Stock Market Forecast Based on AI: Returns up to 23.14% in 14 Days
Stock Market Forecast
This stock market forecast is part of the World Indices Package, as one of I Know First’s quantitative investment solutions. We determine our world indices forecast by screening our database daily using our advanced algorithm. The full World Indices Package includes a daily forecast for a total of 20 indices with bullish and bearish signals:
- Top 10 World Indices for the long position
- Top 10 World Indices for the short position

Package Name: Indices Forecast
Recommended Positions: Long
Forecast Length: 14 Days (10/28/2020 – 11/11/2020)
I Know First Average: 9.49%
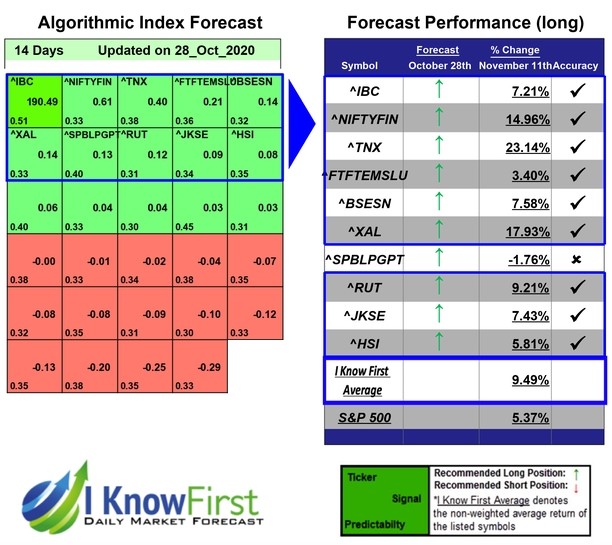

For this 14 Days forecast the algorithm had successfully predicted the changes in 9 out of 10 indices. The top-performing prediction in this forecast was ^TNX, which registered a return of 23.14%. ^XAL and ^NIFTYFIN followed with returns of 17.93% and 14.96% for the 14 Days period. The Indices Forecast package had an overall average return of 9.49%, providing investors with a premium of 4.12% over the S&P 500’s return of 5.37%.
Yields are yield to maturity and pre-tax. Indices have increased in precision as of 5/20/2008 to 4 decimal places. The rates are comprised of Generic United States on-the-run government bill/note/bond indices.
Algorithmic traders utilize these daily forecasts by the I Know First market prediction system as a tool to enhance portfolio performance, verify their own analysis and act on market opportunities faster. This forecast was sent to current I Know First subscribers.
How to interpret this diagram
Algorithmic Stock Forecast: The table on the left is a stock forecast produced by I Know First’s algorithm. Each day, subscribers receive forecasts for six different time horizons. Note that the top 10 stocks in the 1-month forecast may be different than those in the 1-year forecast. In the included table, only the relevant stocks have been included. The boxes are arranged according to their respective signal and predictability values (see below for detailed definitions). A green box represents a positive forecast, suggesting a long position, while a red represents a negative forecast, suggesting a short position.
Please note-for trading decisions use the most recent forecast. Get today’s forecast and Top stock picks.