Stock Market Forecast Based on a Self-learning Algorithm: Returns up to 14.29% in 7 Days
Stock Market Forecast
This stock market forecast is part of the World Indices Package, as one of I Know First’s quantitative investment solutions. We determine our world indices forecast by screening our database daily using our advanced algorithm. The full World Indices Package includes a daily forecast for a total of 20 indices with bullish and bearish signals:
- Top 10 World Indices for the long position
- Top 10 World Indices for the short position

Package Name: Indices Forecast
Recommended Positions: Long
Forecast Length: 7 Days (10/20/2020 – 10/27/2020)
I Know First Average: 1.9%
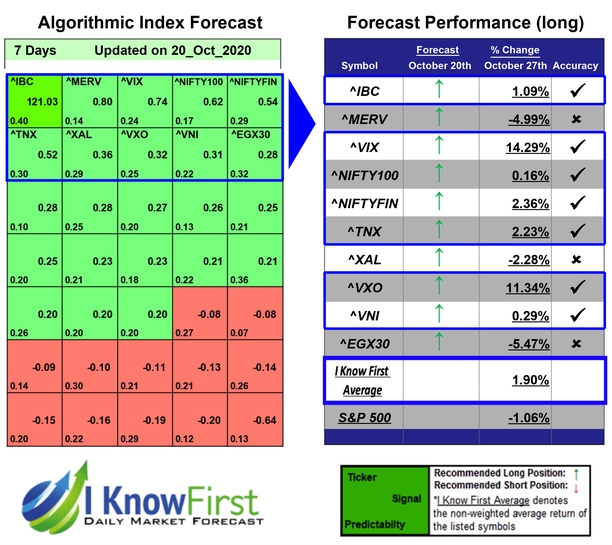
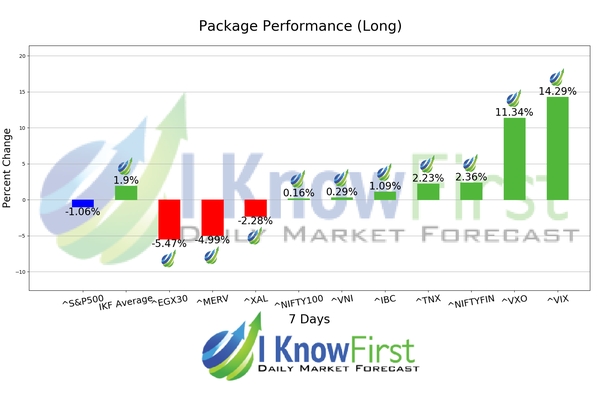
For this 7 Days forecast the algorithm had successfully predicted the changes in 7 out of 10 indices. The greatest return came from ^VIX at 14.29%. ^VXO and ^NIFTYFIN also performed well for this time horizon with returns of 11.34% and 2.36%, respectively. The package had an overall average return of 1.9%, providing investors with a 2.96% premium over the S&P 500’s return of -1.06% during the period.
The Volatility Index, or VIX, is an index created by the Chicago Board Options Exchange (CBOE), which shows the market’s expectation of 30-day volatility. It is constructed using the implied volatilities on S&P 500 index options. This volatility is meant to be forward looking, is calculated from both calls and puts, and is a widely used measure of market risk.
Algorithmic traders utilize these daily forecasts by the I Know First market prediction system as a tool to enhance portfolio performance, verify their own analysis and act on market opportunities faster. This forecast was sent to current I Know First subscribers.
How to interpret this diagram
Algorithmic Stock Forecast: The table on the left is a stock forecast produced by I Know First’s algorithm. Each day, subscribers receive forecasts for six different time horizons. Note that the top 10 stocks in the 1-month forecast may be different than those in the 1-year forecast. In the included table, only the relevant stocks have been included. The boxes are arranged according to their respective signal and predictability values (see below for detailed definitions). A green box represents a positive forecast, suggesting a long position, while a red represents a negative forecast, suggesting a short position.
Please note-for trading decisions use the most recent forecast. Get today’s forecast and Top stock picks.