
Stock Ideas Based on Deep-Learning : Returns up to 78.7% in 14 Days
Stock Ideas
The Fundamental Package includes our algorithmic forecasts for stocks screened by fundamental criteria. Our algorithms help you find best opportunities and stock ideas for both long and short positions for the stocks within each fundamental screen. The stocks are selected according to five basic valuation categories:
- P/E (price to earnings ratio)
- PEG (price/earnings to growth ratio)
- price-to-book ratio
- price-to-sales ratio
- short ratio

Package Name: Fundamental – Low P/E Stocks
Recommended Positions: Long
Forecast Length: 14 Days (9/29/2019 – 10/15/2019)
I Know First Average: 11.92%
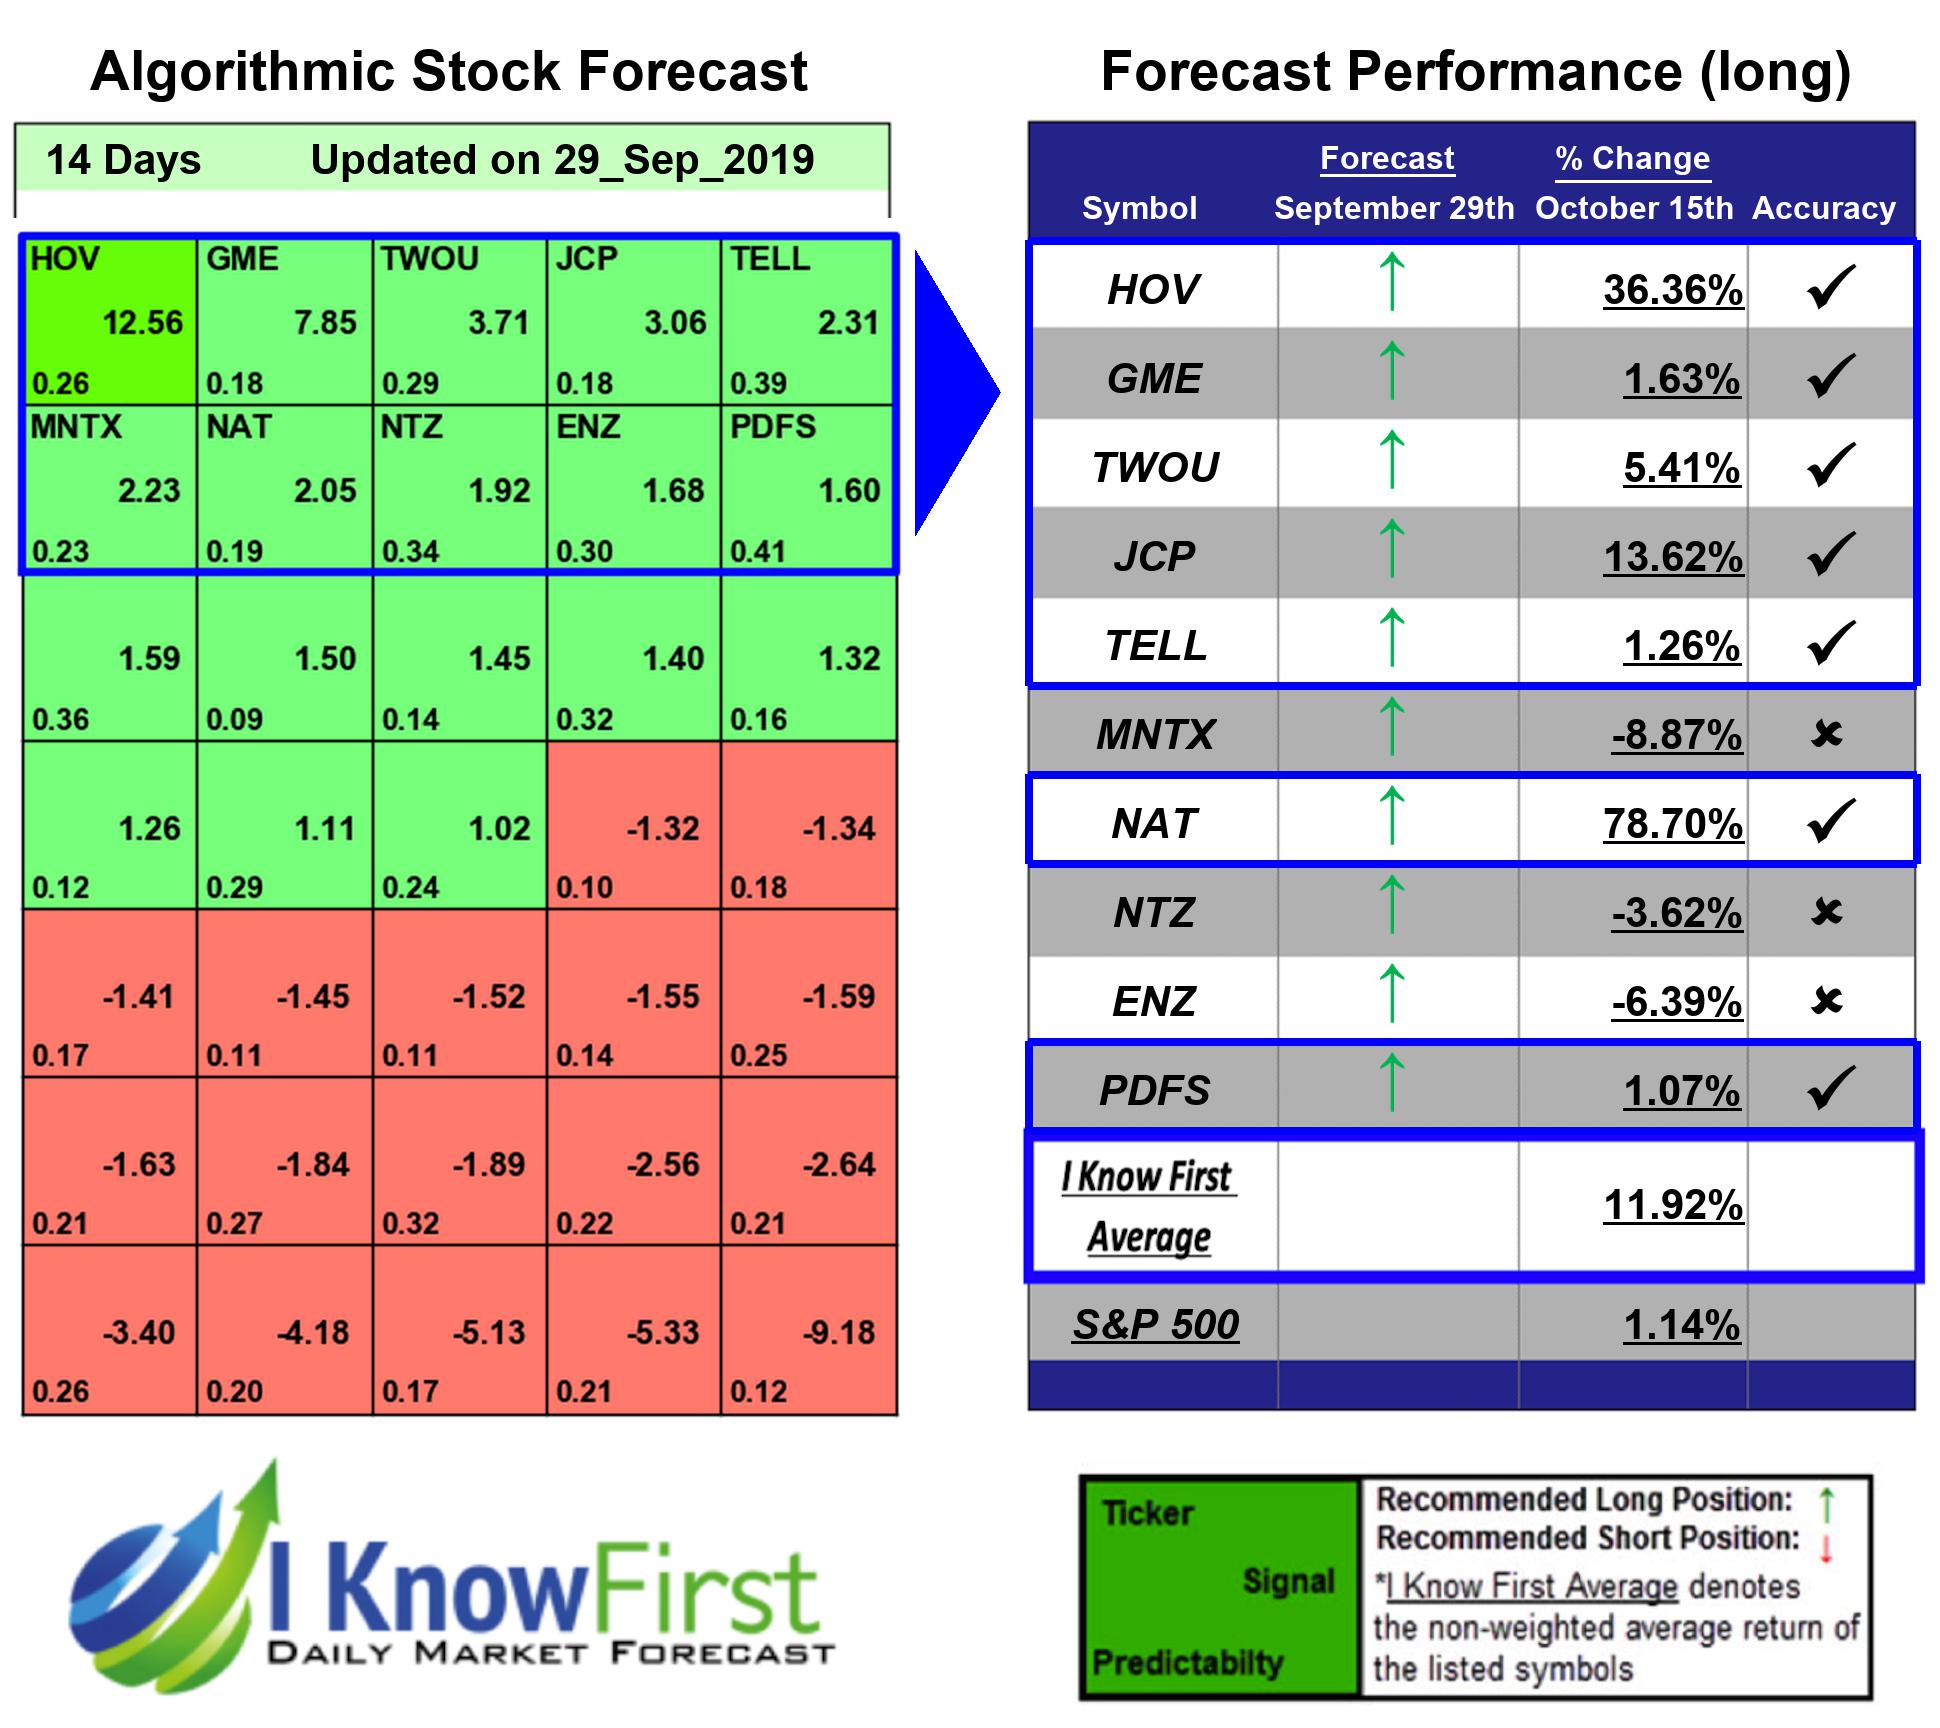

This Fundamental – Low P/E Stocks Package forecast had correctly predicted 7 out of 10 stock movements. NAT was the top performing prediction with a return of 78.7%. Further notable returns came from HOV and JCP at 36.36% and 13.62%, respectively. The package saw an overall yield of 11.92% versus the S&P 500’s return of 1.14% implying a market premium of 10.78%.
Nordic American Tankers Limited (NAT), a tanker company, engages in acquiring and chartering double-hull tankers in Bermuda and internationally. It operates a fleet of 26 Suezmax crude oil tankers. The company was founded in 1995 and is based in Hamilton, Bermuda.
Algorithmic traders utilize these daily forecasts by the I Know First market prediction system as a tool to enhance portfolio performance, verify their own analysis and act on market opportunities faster. This forecast was sent to current I Know First subscribers.
How to interpret this diagram
Algorithmic Stock Forecast: The table on the left is a stock forecast produced by I Know First’s algorithm. Each day, subscribers receive forecasts for six different time horizons. Note that the top 10 stocks in the 1-month forecast may be different than those in the 1-year forecast. In the included table, only the relevant stocks have been included. The boxes are arranged according to their respective signal and predictability values (see below for detailed definitions). A green box represents a positive forecast, suggesting a long position, while a red represents a negative forecast, suggesting a short position.
Please note-for trading decisions use the most recent forecast. Get today’s forecast and Top stock picks.


