
Stock Forecasting Software Based on Predictive Analytics : Returns up to 50.64% in 1 Month
Stock Forecasting Software
This Transportation Stocks forecast is designed for investors and analysts who need stock forecasting software providing predictions for the best stocks to invest in the transport sectors (see Transportation Stocks Package). It includes 20 stocks with bullish and bearish signals:
- Top 10 Transportation stocks for the long position
- Top 10 Transportation stocks for the short position

Package Name: Transportation Stocks
Recommended Positions: Long
Forecast Length: 1 Month (10/4/2019 – 11/5/2019)
I Know First Average: 15.85%
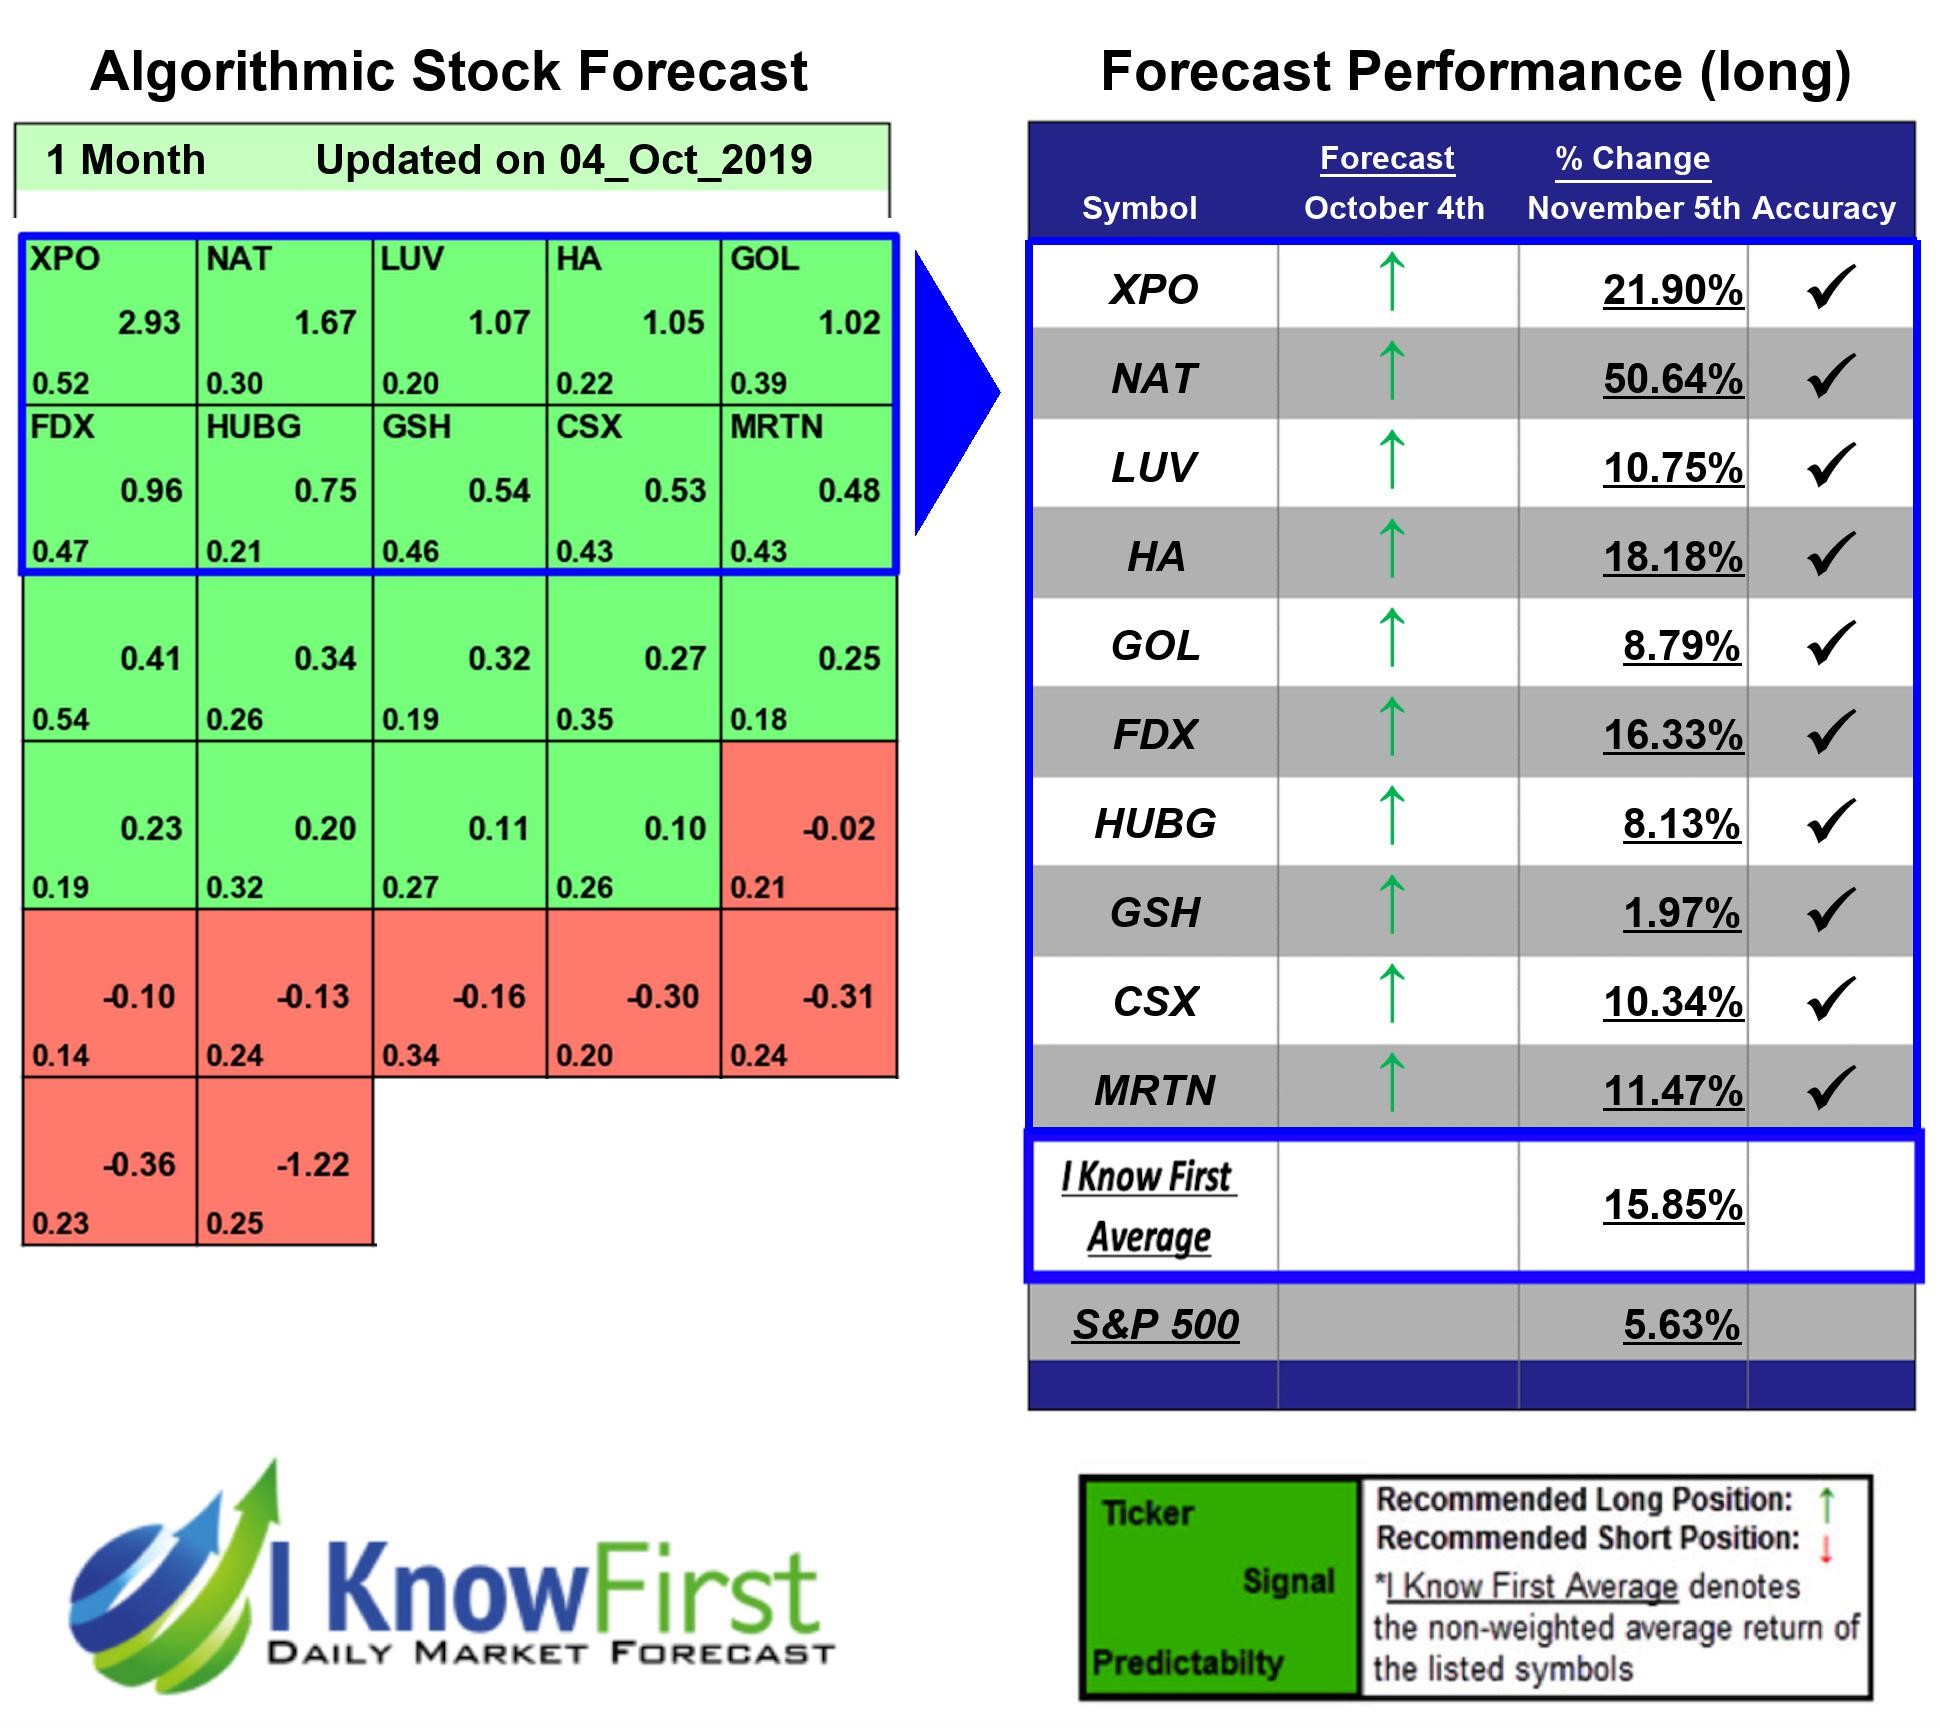
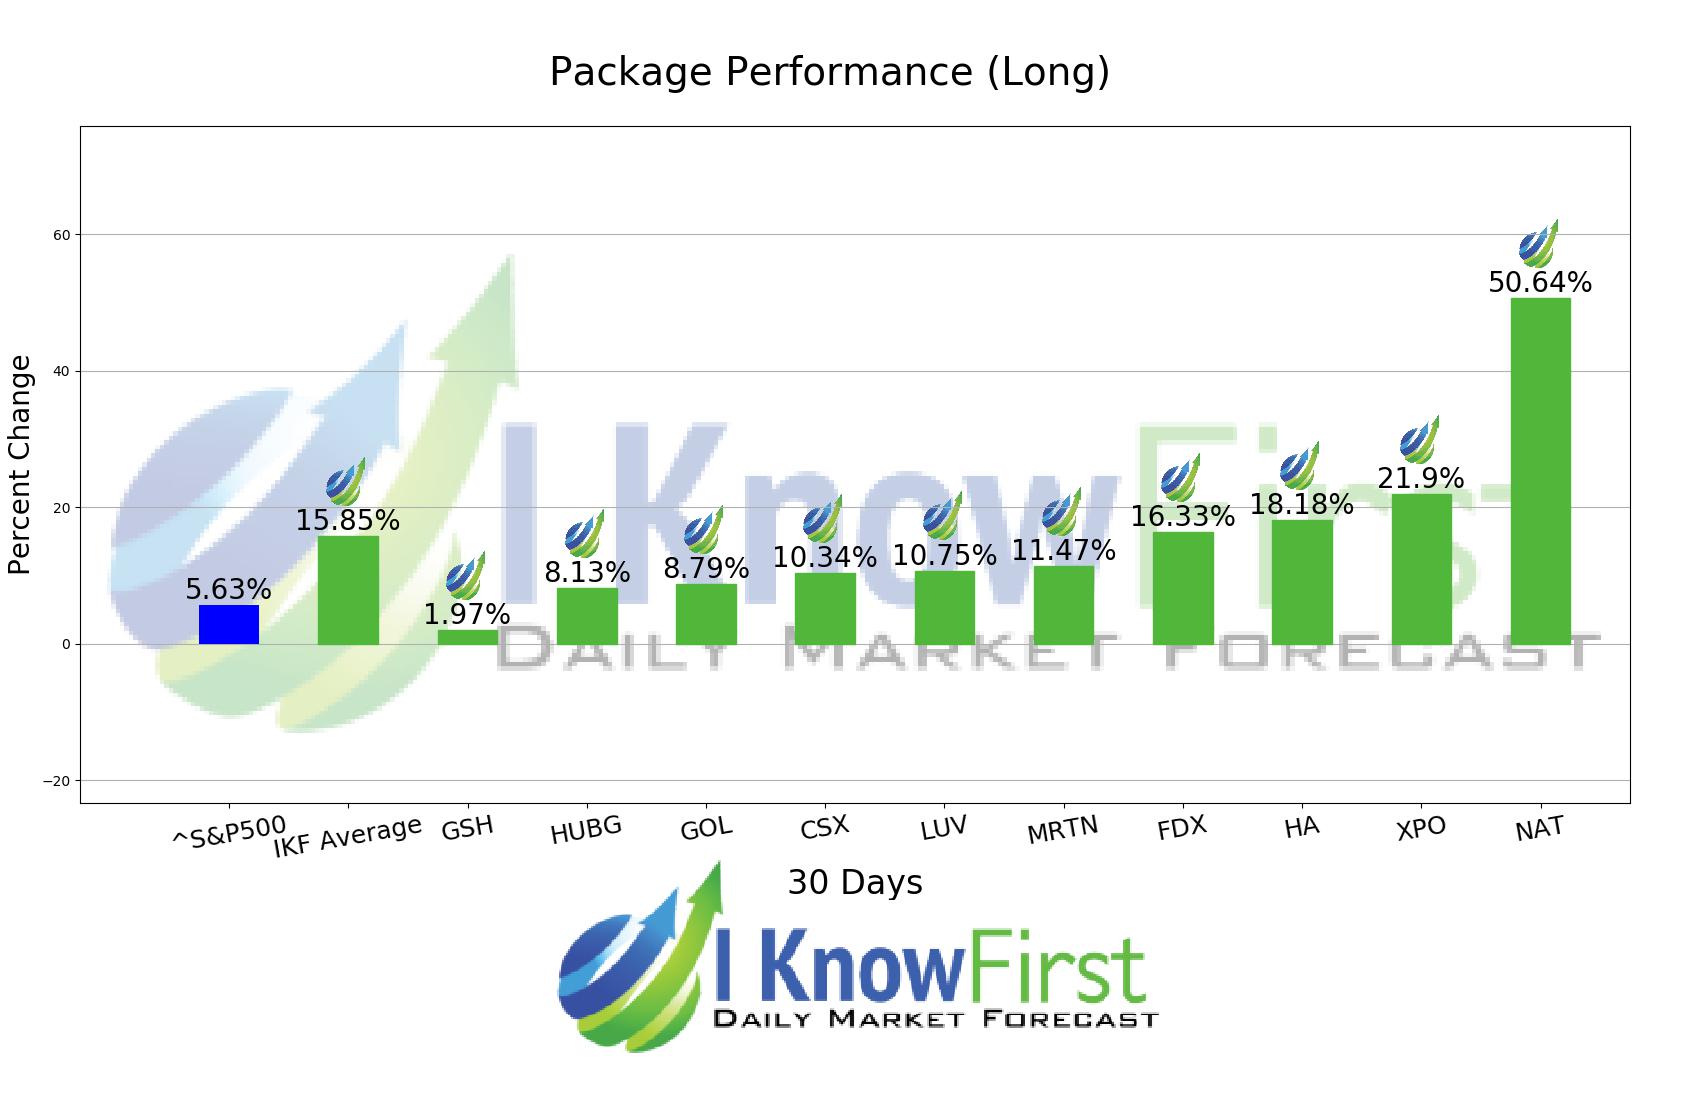
During the 1 Month forecasted period several picks in the Transportation Stocks Package saw significant returns. The algorithm had correctly predicted 10 out 10 returns. The highest trade return came from NAT, at 50.64%. Further notable returns came from XPO and HA at 21.9% and 18.18%, respectively. This algorithmic forecast package presented an overall return of 15.85% versus S&P 500’s performance of 5.63% providing a market premium of 10.22%.
Nordic American Tankers Limited (NAT), a tanker company, engages in acquiring and chartering double-hull tankers in Bermuda and internationally. It operates a fleet of 26 Suezmax crude oil tankers. The company was founded in 1995 and is based in Hamilton, Bermuda.
Algorithmic traders utilize these daily forecasts by the I Know First market prediction system as a tool to enhance portfolio performance, verify their own analysis and act on market opportunities faster. This forecast was sent to current I Know First subscribers.
How to interpret this diagram
Algorithmic Stock Forecast: The table on the left is a stock forecast produced by I Know First’s algorithm. Each day, subscribers receive forecasts for six different time horizons. Note that the top 10 stocks in the 1-month forecast may be different than those in the 1-year forecast. In the included table, only the relevant stocks have been included. The boxes are arranged according to their respective signal and predictability values (see below for detailed definitions). A green box represents a positive forecast, suggesting a long position, while a red represents a negative forecast, suggesting a short position.
Please note-for trading decisions use the most recent forecast. Get today’s forecast and Top stock picks.


