
Stock Forecasting Software Based on Machine Learning: Returns up to 59.05% in 14 Days
Stock Forecasting Software
This Transportation Stocks forecast is designed for investors and analysts who need stock forecasting software predictions for the best stocks to invest in the transport sectors (see Transportation Stocks Package). It includes 20 stocks with bullish and bearish signals:
- Top 10 Transportation stocks for the long position
- Top 10 Transportation stocks for the short position

Package Name: Transportation Stocks
Recommended Positions: Long
Forecast Length: 14 Days (5/31/2020 – 6/15/2020)
I Know First Average: 17.02%
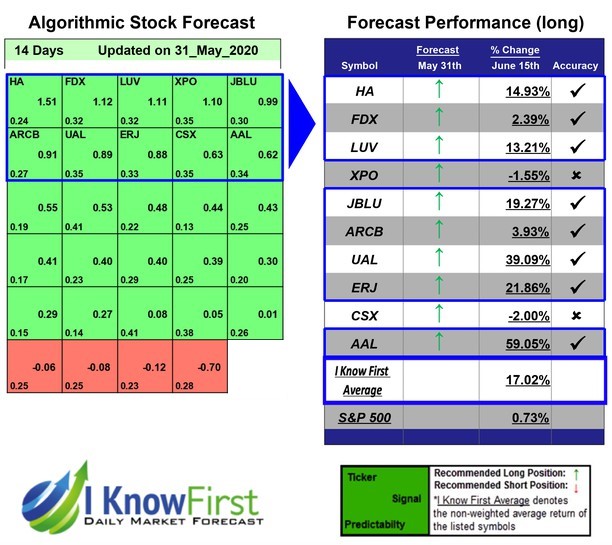
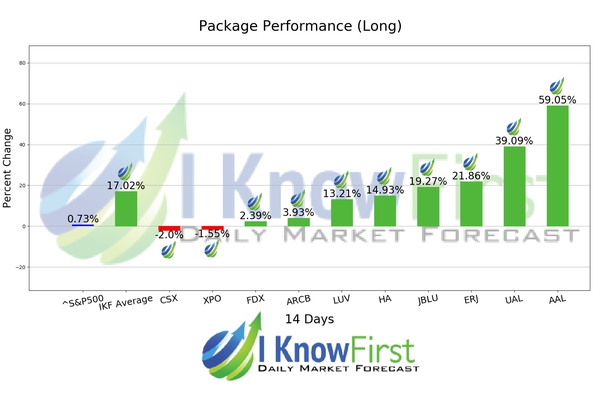
Several predictions in this 14 Days forecast saw significant returns. The algorithm had correctly predicted 8 out 10 stock movements. The top-performing prediction in this forecast was AAL, which registered a return of 59.05%. Other notable stocks were UAL and ERJ with a return of 39.09% and 21.86%. The package itself saw an overall return of 17.02%, providing investors with a 16.29% premium above the S&P 500’s return of 0.73% for the same time period.
American Airlines Group Inc., incorporated on February 16, 1982, is a holding company. The Company’s primary business activity is the operation of a network air carrier, providing scheduled air transportation for passengers and cargo. The Company operates through American segment, which provides air transportation for passengers and cargo. Together with its regional airline subsidiaries and third-party regional carriers operating as American Eagle, its airline operated an average of nearly 6,700 flights per day to nearly 350 destinations in more than 50 countries, principally from its hubs in Charlotte, Chicago, Dallas/Fort Worth, Los Angeles, Miami, New York, Philadelphia, Phoenix and Washington, District of Columbia, as of December 31, 2016. In the fiscal year ended December 31, 2016, approximately 199 million passengers boarded its mainline and regional flights.
Algorithmic traders utilize these daily forecasts by the I Know First market prediction system as a tool to enhance portfolio performance, verify their own analysis and act on market opportunities faster. This forecast was sent to current I Know First subscribers.
How to interpret this diagram
Algorithmic Stock Forecast: The table on the left is a stock forecast produced by I Know First’s algorithm. Each day, subscribers receive forecasts for six different time horizons. Note that the top 10 stocks in the 1-month forecast may be different than those in the 1-year forecast. In the included table, only the relevant stocks have been included. The boxes are arranged according to their respective signal and predictability values (see below for detailed definitions). A green box represents a positive forecast, suggesting a long position, while a red represents a negative forecast, suggesting a short position.
Please note-for trading decisions use the most recent forecast. Get today’s forecast and Top stock picks.


