
Stock Forecasting Software Based on Artificial Intelligence: Returns up to 50.83% in 7 Days
Stock Forecasting Software
This Transportation Stocks forecast is designed for investors and analysts who need stock forecasting software utilizing predictions for the best stocks to invest in the transport sectors (see Transportation Stocks Package). It includes 20 stocks with bullish and bearish signals:
- Top 10 Transportation stocks for the long position
- Top 10 Transportation stocks for the short position

Package Name: Transportation Stocks
Recommended Positions: Long
Forecast Length: 7 Days (11/1/2020 – 11/9/2020)
I Know First Average: 16.79%
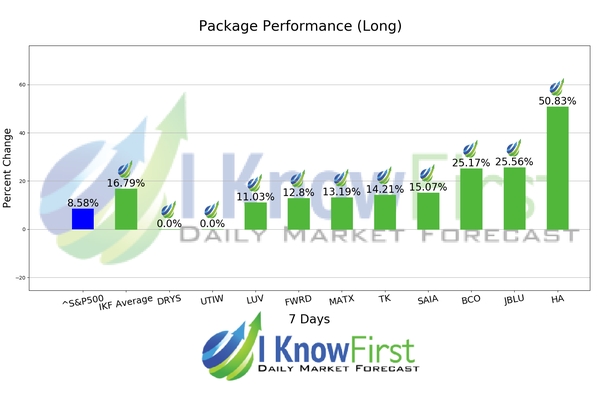
For this 7 Days forecast the algorithm had successfully predicted 8 out of 10 movements. HA was the top performing prediction with a return of 50.83%. JBLU and BCO also performed well for this time horizon with returns of 25.56% and 25.17%, respectively. The package saw an overall yield of 16.79% versus the S&P 500’s return of 8.58% implying a market premium of 8.21%.
Hawaiian Holdings, Inc. (HA) provides scheduled and charter air transportation of passengers, cargo, and mail. The Company provides its services among the islands of Hawaii and between Hawaii and several West Coast gateway cities and destinations in the South Pacific.
Algorithmic traders utilize these daily forecasts by the I Know First market prediction system as a tool to enhance portfolio performance, verify their own analysis and act on market opportunities faster. This forecast was sent to current I Know First subscribers.
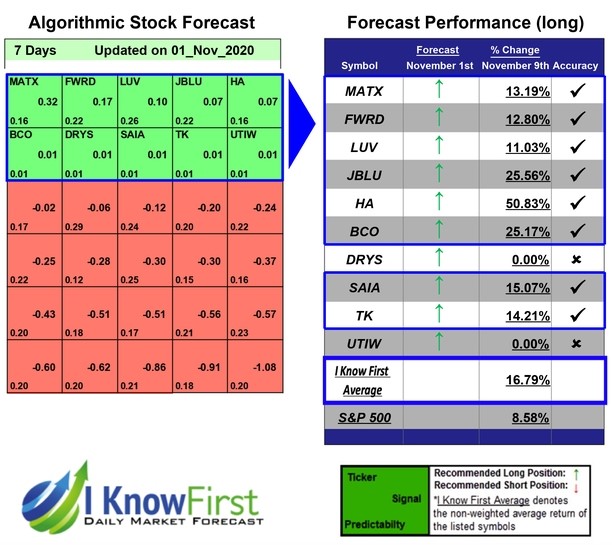
How to interpret this diagram
Algorithmic Stock Forecast: The table on the left is a stock forecast produced by I Know First’s algorithm. Each day, subscribers receive forecasts for six different time horizons. Note that the top 10 stocks in the 1-month forecast may be different than those in the 1-year forecast. In the included table, only the relevant stocks have been included. The boxes are arranged according to their respective signal and predictability values (see below for detailed definitions). A green box represents a positive forecast, suggesting a long position, while a red represents a negative forecast, suggesting a short position.
Please note-for trading decisions use the most recent forecast. Get today’s forecast and Top stock picks.


