
Stock Forecasting Software Based on Artificial Intelligence: Returns up to 34.09% in 3 Days
Stock Forecasting Software
This Transportation Stocks forecast is designed for investors and analysts who need a stock forecasting software for the best stocks to invest in the transport sectors (see Transportation Stocks Package). It includes 20 stocks with bullish and bearish signals:
- Top 10 Transportation stocks for the long position
- Top 10 Transportation stocks for the short position

Package Name: Transportation Stocks
Recommended Positions: Long
Forecast Length: 3 Days (10/8/2019 – 10/11/2019)
I Know First Average: 7.25%

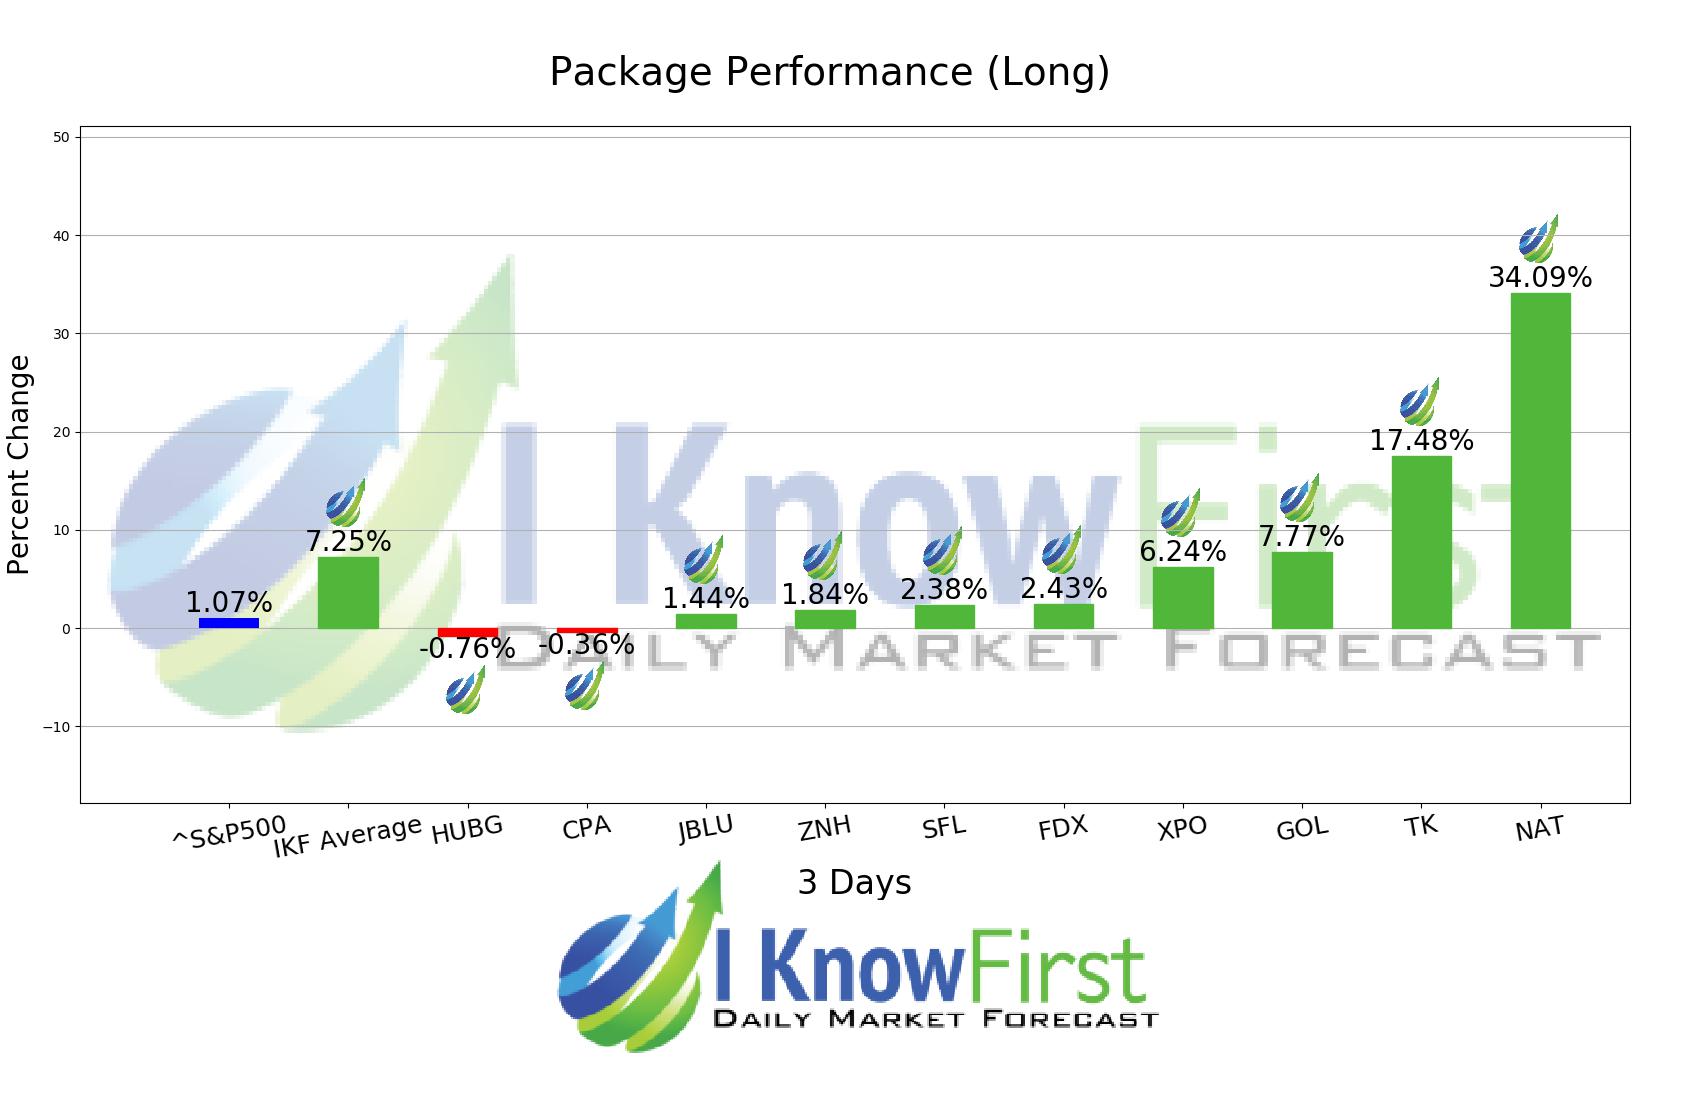
I Know First’s State of the Art Algorithm accurately forecasted 8 out of 10 trades in this Transportation Stocks Package for the 3 Days time period. The top performing prediction from this package was NAT with a return of 34.09%. The suggested trades for TK and GOL also had notable 3 Days yields of 17.48% and 7.77%, respectively. This algorithmic forecast package presented an overall return of 7.25% versus S&P 500’s performance of 1.07% providing a market premium of 6.18%.
Nordic American Tankers Limited (NAT), a tanker company, engages in acquiring and chartering double-hull tankers in Bermuda and internationally. It operates a fleet of 26 Suezmax crude oil tankers. The company was founded in 1995 and is based in Hamilton, Bermuda.
Algorithmic traders utilize these daily forecasts by the I Know First market prediction system as a tool to enhance portfolio performance, verify their own analysis and act on market opportunities faster. This forecast was sent to current I Know First subscribers.
How to interpret this diagram
Algorithmic Stock Forecast: The table on the left is a stock forecast produced by I Know First’s algorithm. Each day, subscribers receive forecasts for six different time horizons. Note that the top 10 stocks in the 1-month forecast may be different than those in the 1-year forecast. In the included table, only the relevant stocks have been included. The boxes are arranged according to their respective signal and predictability values (see below for detailed definitions). A green box represents a positive forecast, suggesting a long position, while a red represents a negative forecast, suggesting a short position.
Please note-for trading decisions use the most recent forecast. Get today’s forecast and Top stock picks.


