
Stock Forecasting Based on Genetic Algorithms: Returns up to 13.67% in 3 Days
Stock Forecasting
This Stock Forecasting is part of the Fundamental Package includes our algorithmic forecasts for stocks screened by fundamental criteria. Our algorithms help you find best opportunities for both long and short positions for the stocks within each fundamental screen. The stocks are selected according to five basic valuation categories:
- P/E (price to earnings ratio)
- PEG (price/earnings to growth ratio)
- price-to-book ratio
- price-to-sales ratio
- short ratio

Package Name: Fundamental – Low P/E Stocks
Recommended Positions: Long
Forecast Length: 3 Days (9/27/2020 – 10/1/2020)
I Know First Average: 3.4%

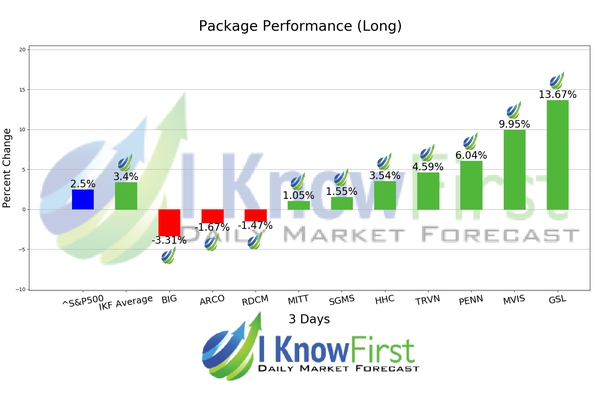
For this 3 Days forecast the algorithm had successfully predicted 7 out of 10 movements. The greatest return came from GSL at 13.67%. Additional high returns came from MVIS and PENN, at 9.95% and 6.04% respectively. The package itself saw an overall return of 3.4%, providing investors with a 0.90% premium above the S&P 500’s return of 2.5% for the same time period.
Global Ship Lease, Inc. (GSL) owns and charters containerships of various sizes under long-term, fixed-rate charters to container shipping companies. As at March 31, 2016, the company owned 18 vessels with a total capacity of 82,312 twenty-foot equivalent units. Global Ship Lease, Inc. (GSL) is based in London, the United Kingdom.
Algorithmic traders utilize these daily forecasts by the I Know First market prediction system as a tool to enhance portfolio performance, verify their own analysis and act on market opportunities faster. This forecast was sent to current I Know First subscribers.
How to interpret this diagram
Algorithmic Stock Forecast: The table on the left is a stock forecast produced by I Know First’s algorithm. Each day, subscribers receive forecasts for six different time horizons. Note that the top 10 stocks in the 1-month forecast may be different than those in the 1-year forecast. In the included table, only the relevant stocks have been included. The boxes are arranged according to their respective signal and predictability values (see below for detailed definitions). A green box represents a positive forecast, suggesting a long position, while a red represents a negative forecast, suggesting a short position.
Please note-for trading decisions use the most recent forecast. Get today’s forecast and Top stock picks.


