
Stock Forecasting Based on Algorithmic Trading: Returns up to 17.82% in 3 Days
Stock Forecasting
An insider is legally permitted to buy and sell shares of the firm – and any subsidiaries – that employs him or her. However, these transactions must be properly registered with the Securities and Exchange Commission (SEC) and are done with advance filings. You can find details of this type of insider trading on the SEC’s EDGAR database. This algorithmic stock forecasting is for stocks with recently reported insiders’ transactions.
An “insider” is any person who possesses at least one of the following:
- access to valuable non-public information about a corporation (for example a company’s directors and high-level executives)
- ownership of more than 10% of the company’s equity

Package Name: Insider Trades
Recommended Positions: Long
Forecast Length: 3 Days (2/21/21 – 2/24/21)
I Know First Average: 3.19%
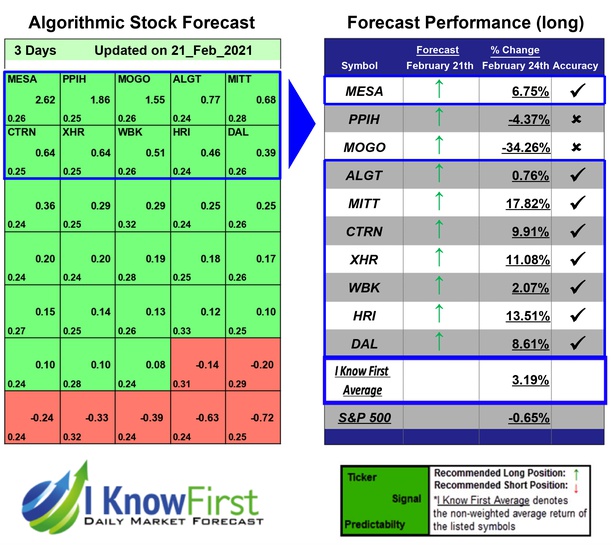
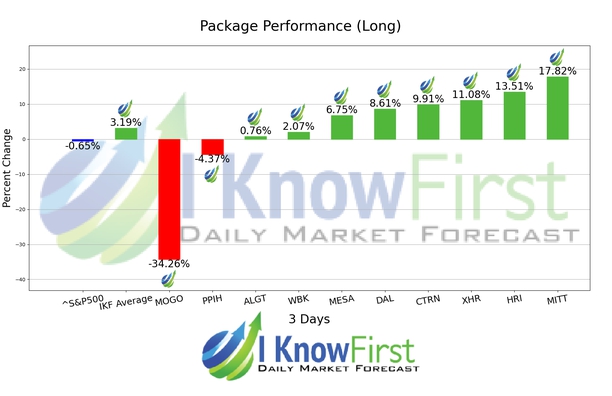
During this 3 Days stock forecasting period several picks in the Insider Trades Package saw significant returns. The algorithm had correctly predicted 8 out 10 returns. The top-performing prediction in this forecast was MITT, which registered a return of 17.82%. HRI and XHR followed with returns of 13.51% and 11.08% for the 3 Days period. The package itself saw an overall return of 3.19%, providing investors with a 3.84% premium above the S&P 500’s return of -0.65% for the same time period.
AG Mortgage Investment Trust, Inc. (MITT), a real estate investment trust, focuses on investing in, acquiring, and managing a portfolio of residential mortgage assets, other real estate-related securities, and financial assets. It invests in residential mortgage-backed securities (RMBS), for which a U.S. government agency guarantees payments of principal and interest on the securities; and fixed- and floating-rate residential non-agency RMBS that are not issued by a U.S. government agencies or U.S. government-sponsored entities. The company also invests in other real estate-related assets and financial assets, such as fixed- and floating-rate commercial mortgage-backed securities, including investment grade and non-investment grade classes; residential mortgage loans secured by residential real property; and commercial mortgage loans secured by commercial real property, including mezzanine loans and preferred equity. In addition, its other real estate-related assets and financial assets investments include first or second lien loans, subordinate interests in first mortgages, and mezzanine financing secured by interests in commercial real estate, as well as bridge loans to be used in the acquisition, construction, or redevelopment of a property; other real estate structured finance products, mortgage servicing rights, real estate-related loans and securities, and other financial assets; and investment grade and non-investment grade debt and equity tranches of securitizations backed by various asset classes, such as small balance commercial mortgages, aircraft, automobiles, credit cards, equipment, manufactured housing, franchises, recreational vehicles, and student loans. The company qualifies as a real estate investment trust for federal income tax purposes. It generally would not be subject to federal corporate income taxes if it distributes at least 90% of its taxable income to its stockholders. The company was incorporated in 2011 and is based in New York, New York.
Algorithmic traders utilize these daily forecasts by the I Know First market prediction system as a tool to enhance portfolio performance, verify their own analysis and act on market opportunities faster. This forecast was sent to current I Know First subscribers.
How to interpret this diagram
Algorithmic Stock Forecast: The table on the left is a stock forecast produced by I Know First’s algorithm. Each day, subscribers receive forecasts for six different time horizons. Note that the top 10 stocks in the 1-month forecast may be different than those in the 1-year forecast. In the included table, only the relevant stocks have been included. The boxes are arranged according to their respective signal and predictability values (see below for detailed definitions). A green box represents a positive forecast, suggesting a long position, while a red represents a negative forecast, suggesting a short position.
Please note-for trading decisions use the most recent forecast. Get today’s forecast and Top stock picks.


