
Small Cap Stocks To Buy Based on Algo Trading: Returns up to 20.18% in 1 Month
Small Cap Stocks To Buy
The Small Cap Package includes recommendations by the I Know First algorithm for small cap stocks to buy with a market capitalization of less than $1 billion:
- Top 10 Small Cap stocks to buy for the long position
- Top 10 Small Cap stocks to buy for the short position

Package Name: Small Cap Forecast
Recommended Positions: Long
Forecast Length: 1 Month (7/16/2019 – 8/16/2019)
I Know First Average: 1.93%
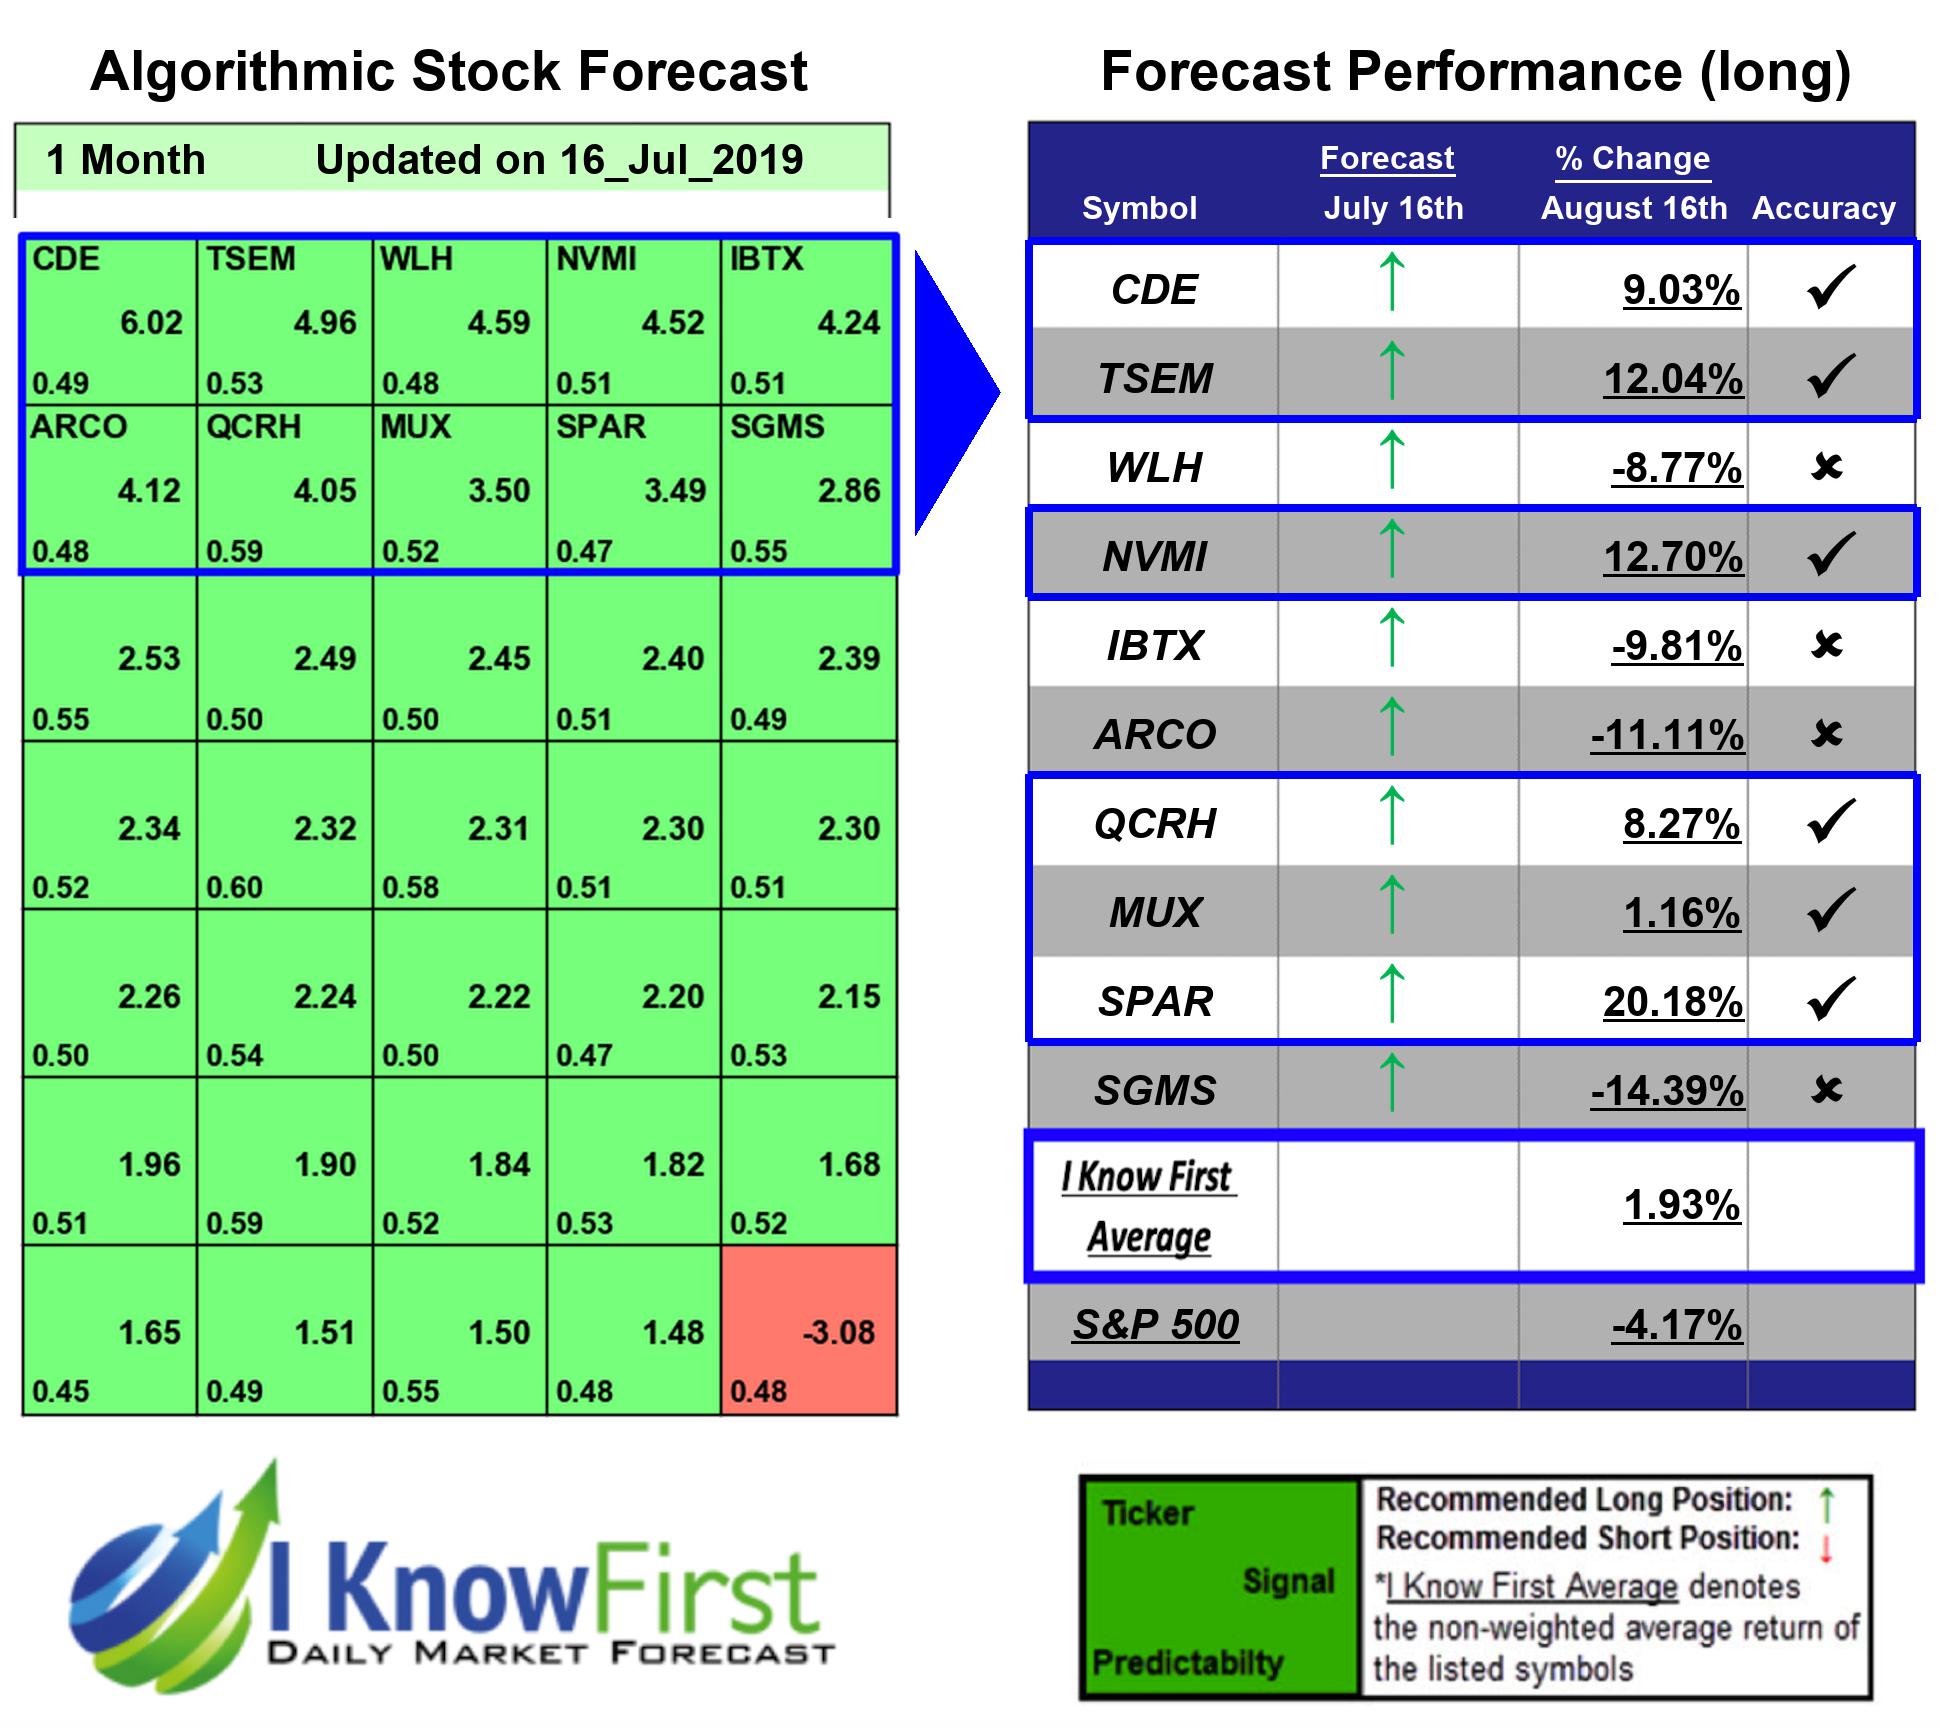
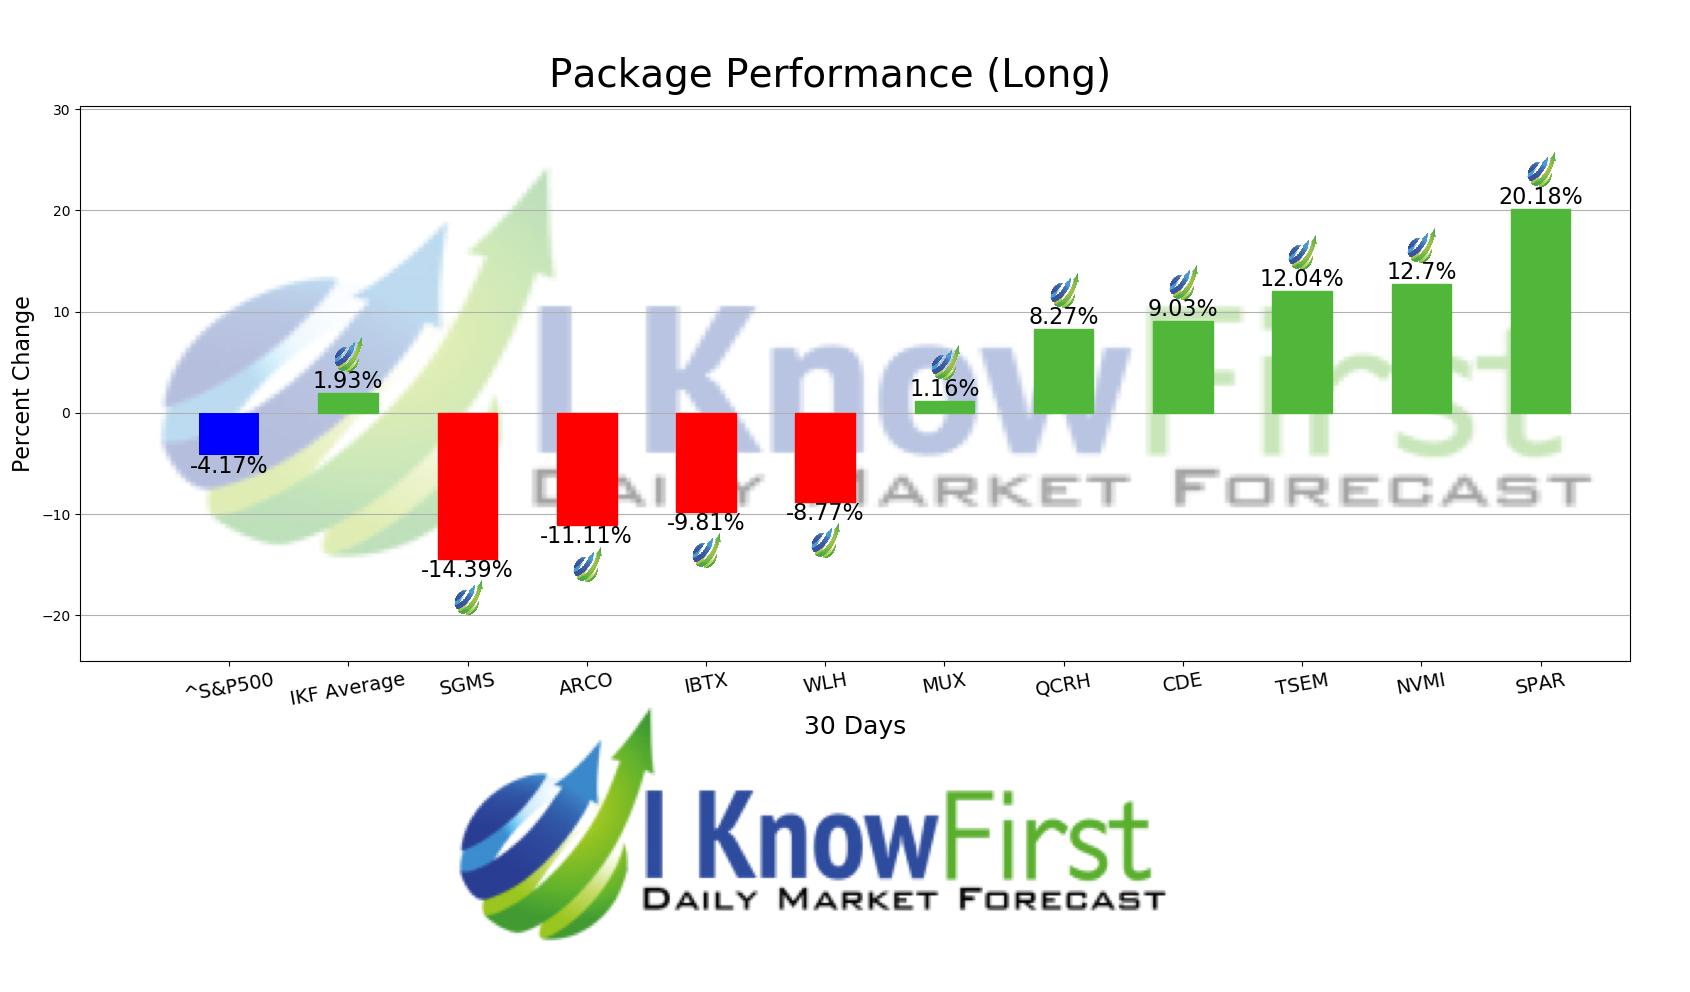
The algorithm correctly predicted 6 out 10 of the suggested trades in the Small Cap Forecast Package for this 1 Month forecast. SPAR was our best stock pick this week a return of 20.18%. The suggested trades for NVMI and TSEM also had notable 1 Month yields of 12.7% and 12.04%, respectively. The overall average return in this Small Cap Forecast package was 1.93%, providing investors with a 6.10% premium over the S&P 500’s return of -4.17% during the same period.
Spartan Motors, Inc., through its subsidiaries, engineers, manufactures, and sells heavy-duty and custom vehicles in the United States, Canada, South America, and Asia. It operates through three segments: Emergency Response Vehicles, Fleet Vehicles and Services, and Specialty Chassis and Vehicles.
Algorithmic traders utilize these daily forecasts by the I Know First market prediction system as a tool to enhance portfolio performance, verify their own analysis and act on market opportunities faster. This forecast was sent to current I Know First subscribers.
How to interpret this diagram
Algorithmic Stock Forecast: The table on the left is a stock forecast produced by I Know First’s algorithm. Each day, subscribers receive forecasts for six different time horizons. Note that the top 10 stocks in the 1-month forecast may be different than those in the 1-year forecast. In the included table, only the relevant stocks have been included. The boxes are arranged according to their respective signal and predictability values (see below for detailed definitions). A green box represents a positive forecast, suggesting a long position, while a red represents a negative forecast, suggesting a short position.
Please note-for trading decisions use the most recent forecast. Get today’s forecast and Top stock picks.


