
Small Cap Stocks Based on Deep Learning: Returns up to 12.96% in 14 Days
Small Cap Stocks
The Small Cap Stocks Package includes recommendations by the I Know First algorithm for small cap stocks to buy with a market capitalization of less than $1 billion:
- Top 10 Small Cap stocks to buy for the long position
- Top 10 Small Cap stocks to buy for the short position

Package Name: Small Cap Forecast
Recommended Positions: Long
Forecast Length: 14 Days (7/20/21 – 8/3/21)
I Know First Average: 4.61%
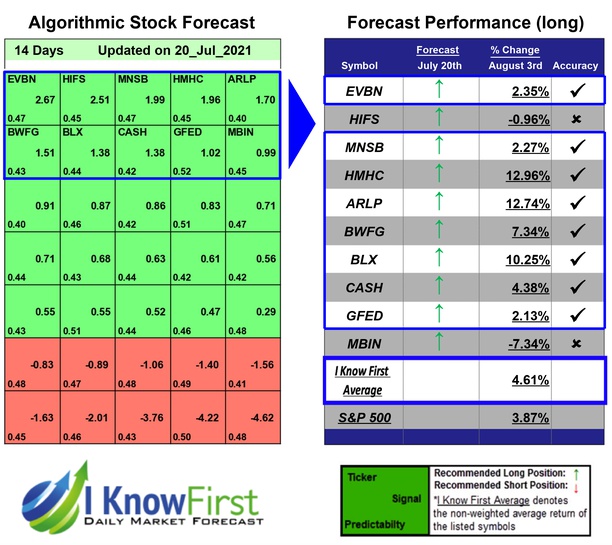
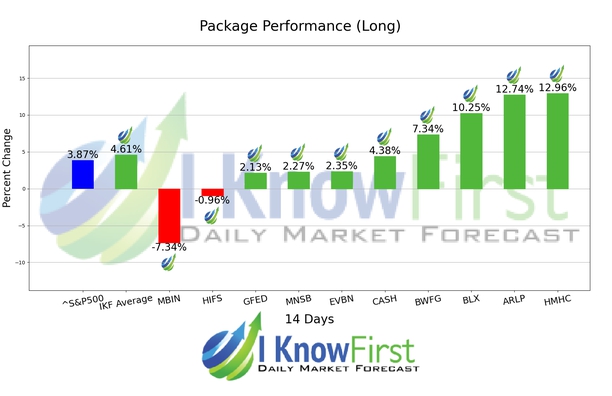
8 out of 10 stock prices in this forecast for the Small Cap Forecast Package moved as predicted by the algorithm. The highest trade return came from HMHC, at 12.96%. Other notable stocks were ARLP and BLX with a return of 12.74% and 10.25%. The package had an overall average return of 4.61%, providing investors with a 0.74% premium over the S&P 500’s return of 3.87% during the period.
Houghton Mifflin Harcourt Company (HMH), incorporated on December 23, 2009, is a global learning company, specializing in education solutions across a range of media. The Company operates through two segments: Education and Trade Publishing. As of December 31, 2016, the Company delivered content, services and technology to both educational institutions and consumers, reaching over 50 million students in approximately 150 countries across the world. In the United States, the Company is a provider of kindergarten through 12th grade (K-12) educational content. It sells its products and services across multiple media and distribution channels.
Algorithmic traders utilize these daily forecasts by the I Know First market prediction system as a tool to enhance portfolio performance, verify their own analysis and act on market opportunities faster. This forecast was sent to current I Know First subscribers.
How to interpret this diagram
Algorithmic Stock Forecast: The table on the left is a stock forecast produced by I Know First’s algorithm. Each day, subscribers receive forecasts for six different time horizons. Note that the top 10 stocks in the 1-month forecast may be different than those in the 1-year forecast. In the included table, only the relevant stocks have been included. The boxes are arranged according to their respective signal and predictability values (see below for detailed definitions). A green box represents a positive forecast, suggesting a long position, while a red represents a negative forecast, suggesting a short position.
Please note-for trading decisions use the most recent forecast. Get today’s forecast and Top stock picks.


