
Small Cap Stocks Based on Big Data Analytics: Returns up to 21.22% in 7 Days
Small Cap Stocks
The Small Cap Package includes recommendations by the I Know First algorithm for small cap stocks to buy with a market capitalization of less than $1 billion:
- Top 10 Small Cap stocks to buy for the long position
- Top 10 Small Cap stocks to buy for the short position

Package Name: Small Cap Forecast
Recommended Positions: Long
Forecast Length: 7 Days (2/5/2020 – 2/12/2020)
I Know First Average: 4.43%

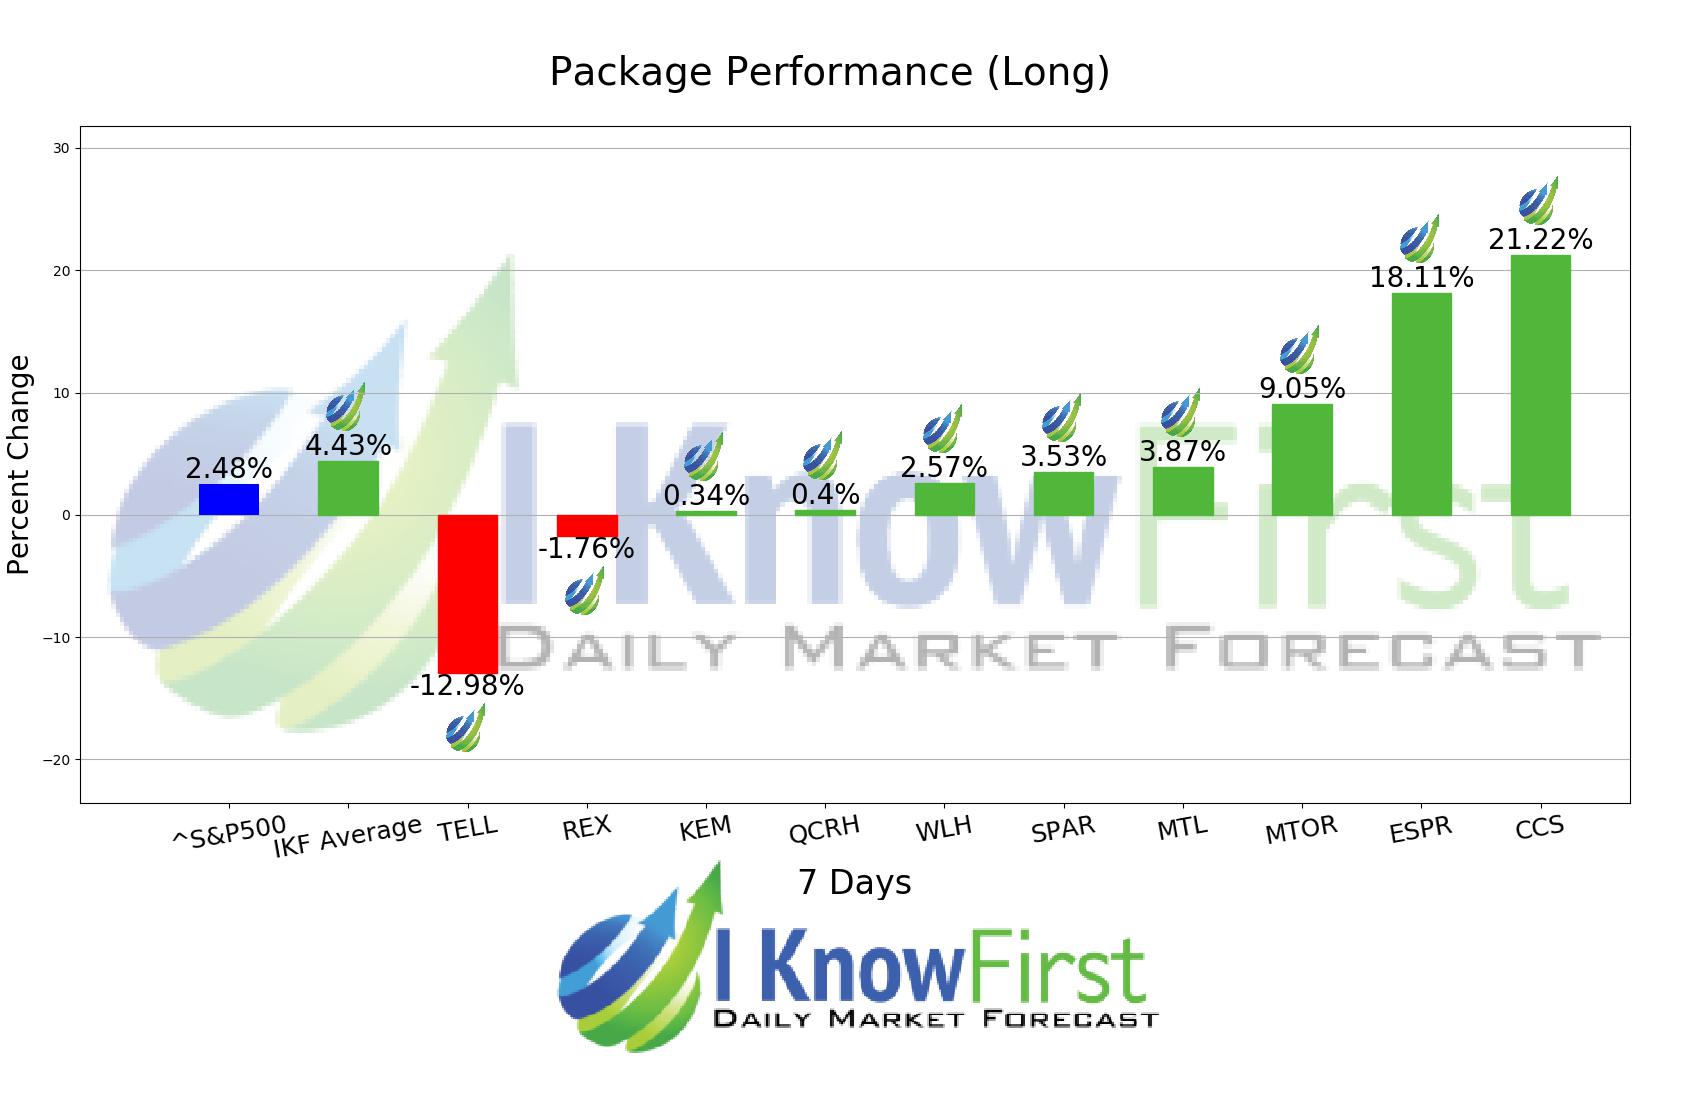
The algorithm correctly predicted 8 out 10 of the suggested trades in the Small Cap Forecast Package for this 7 Days forecast. CCS was the top performing prediction with a return of 21.22%. Further notable returns came from ESPR and MTOR at 18.11% and 9.05%, respectively. The package had an overall average return of 4.43%, providing investors with a premium of 1.95% over the S&P 500’s return of 2.48% during the same period.
Century Communities, Inc. (CCS) engages in homebuilding business in Atlanta, Central Texas, Colorado, Houston, and Nevada. It is involved in the development, design, construction, marketing, and sale of single-family attached and detached homes, as well as acquisition, entitlement, and development of land. The company sells homes through its sales representatives, as well as through independent real estate brokers. Century Communities, Inc. (CCS) was founded in 2000 and is headquartered in Greenwood Village, Colorado.
Algorithmic traders utilize these daily forecasts by the I Know First market prediction system as a tool to enhance portfolio performance, verify their own analysis and act on market opportunities faster. This forecast was sent to current I Know First subscribers.
How to interpret this diagram
Algorithmic Stock Forecast: The table on the left is a stock forecast produced by I Know First’s algorithm. Each day, subscribers receive forecasts for six different time horizons. Note that the top 10 stocks in the 1-month forecast may be different than those in the 1-year forecast. In the included table, only the relevant stocks have been included. The boxes are arranged according to their respective signal and predictability values (see below for detailed definitions). A green box represents a positive forecast, suggesting a long position, while a red represents a negative forecast, suggesting a short position.
Please note-for trading decisions use the most recent forecast. Get today’s forecast and Top stock picks.


