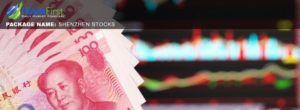
Shenzhen Stocks Based on Big Data Analytics : Returns up to 35.3% in 3 Months
Shenzhen Stocks
This forecast for Shenzhen Stocks is part of the By Country Package, as one of I Know First’s algorithmic trading tools. The full forecast includes daily predictions for a total of 20 stocks with bullish and bearish signals:
- Top 10 Shenzhen stocks for the long position
- Top 10 Shenzhen stocks for the short position
Package Name: Shenzhen Stock Forecast
Recommended Positions: Long
Forecast Length: 3 Months (6/9/2019 – 9/9/2019)
I Know First Average: 10.25%
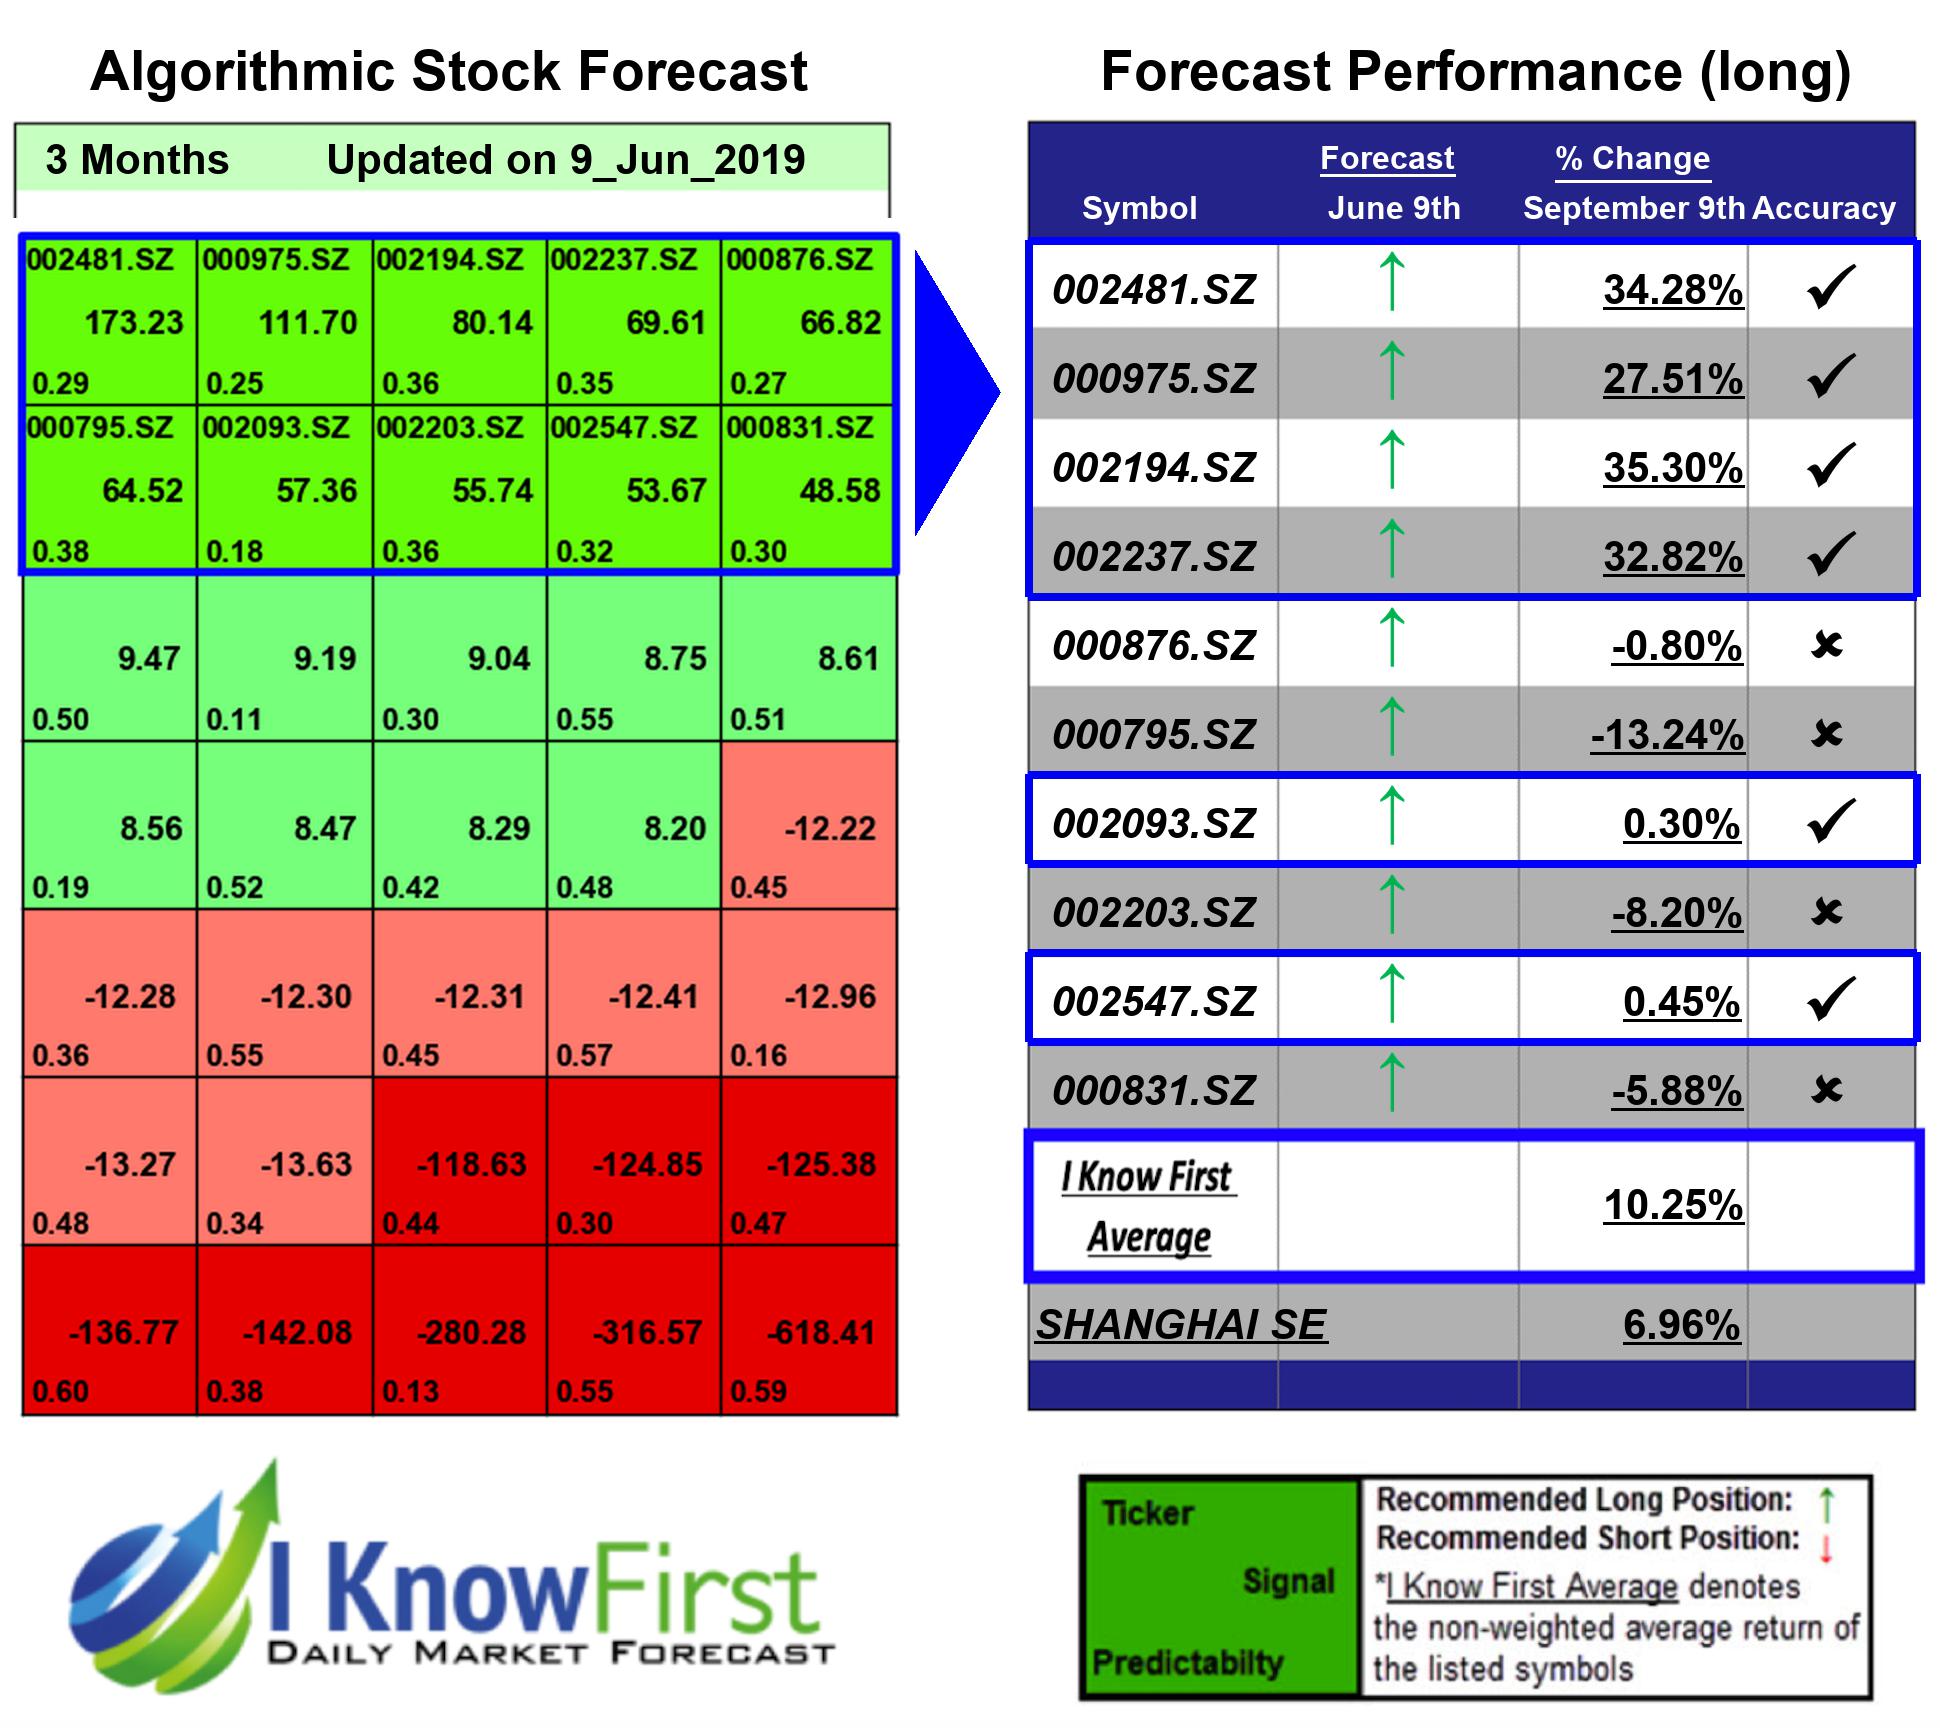
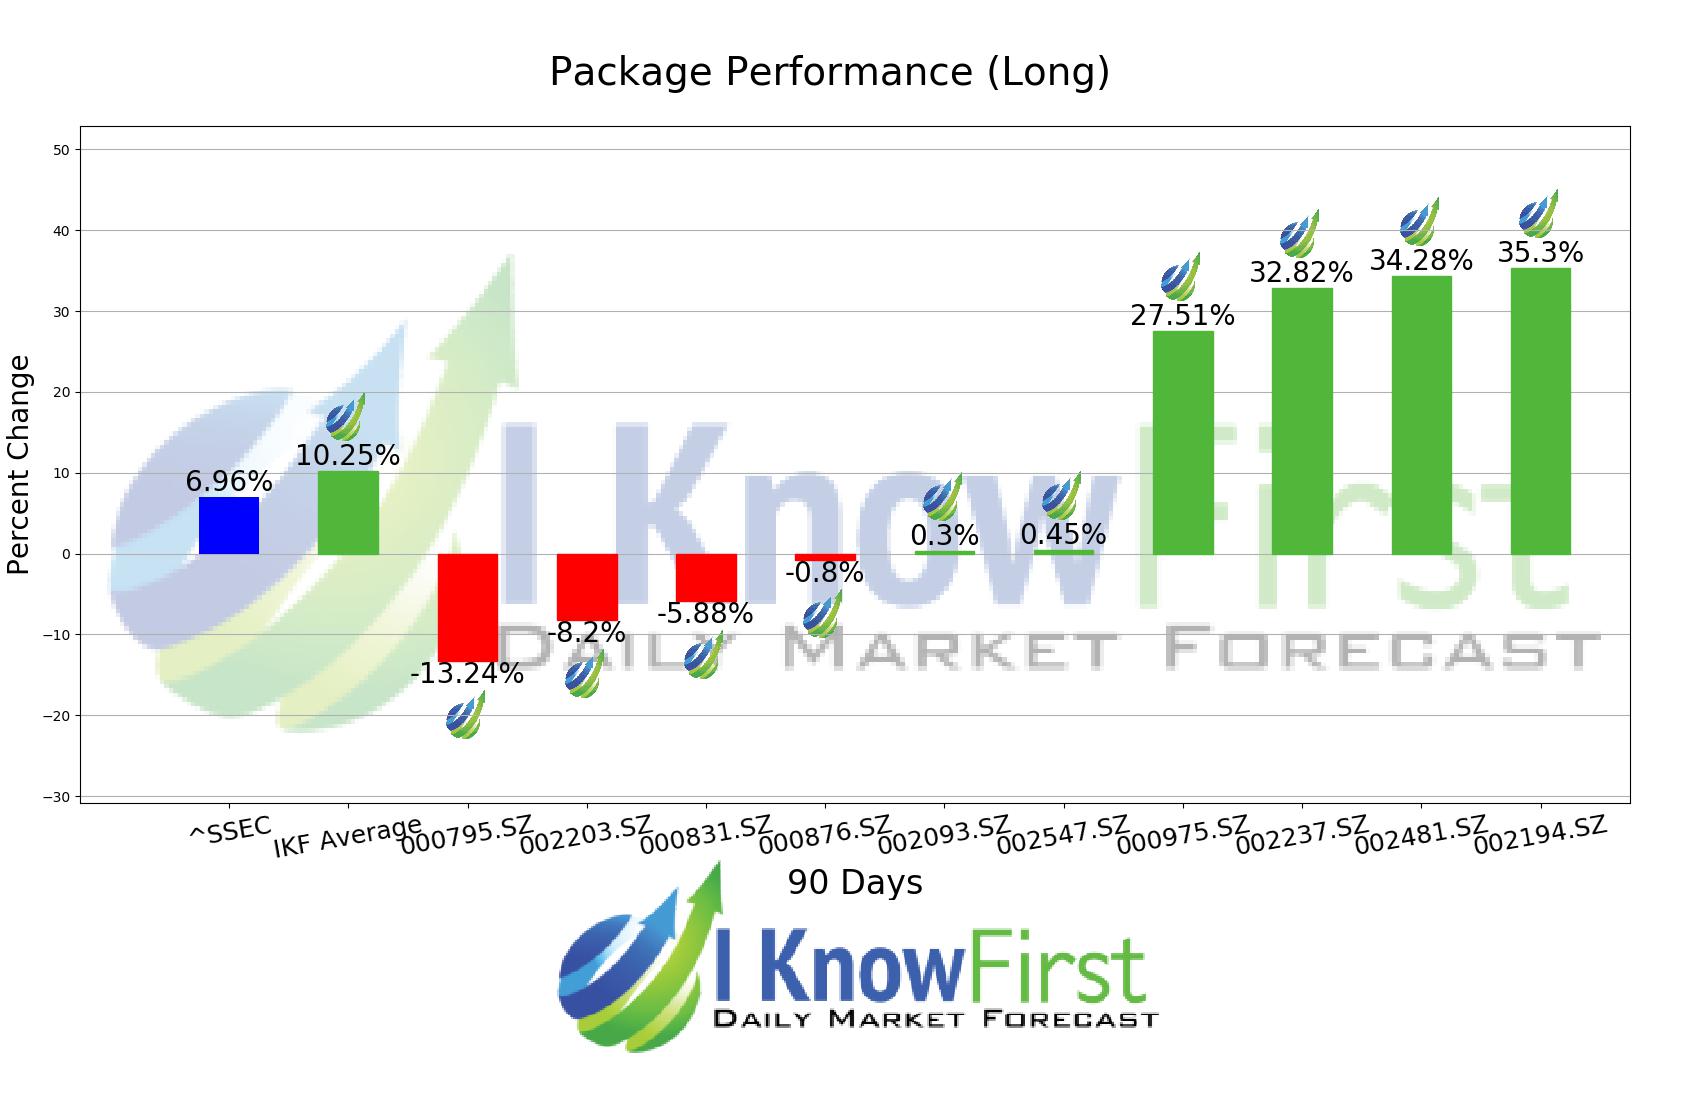
This Shenzhen Stock Forecast Package forecast had correctly predicted 6 out of 10 stock movements. The highest trade return came from 002194.SZ, at 35.3%. Additional high returns came from 002481.SZ and 002237.SZ, at 34.28% and 32.82% respectively. The package had an overall average return of 10.25%, providing investors with a 3.29% premium over the SHANGHAI SE’s return of 6.96% during the period.
Wuhan Fingu Electronic Technology Co., LTD. is a China-based company, principally engaged in the research and development, production and distribution of radio frequency (RF) components and RF subsystems, as well as the provision of related services. The Company’s main products portfolio consists of duplexers, filters and RF subsystems, among others. The Company’s products are mainly applied in the front ends of antenna-feeder systems of mobile communication base stations. The Company distributes its products within domestic market and to overseas markets.
Algorithmic traders utilize these daily forecasts by the I Know First market prediction system as a tool to enhance portfolio performance, verify their own analysis and act on market opportunities faster. This forecast was sent to current I Know First subscribers.
How to interpret this diagram
Algorithmic Stock Forecast: The table on the left is a stock forecast produced by I Know First’s algorithm. Each day, subscribers receive forecasts for six different time horizons. Note that the top 10 stocks in the 1-month forecast may be different than those in the 1-year forecast. In the included table, only the relevant stocks have been included. The boxes are arranged according to their respective signal and predictability values (see below for detailed definitions). A green box represents a positive forecast, suggesting a long position, while a red represents a negative forecast, suggesting a short position.
Please note-for trading decisions use the most recent forecast. Get today’s forecast and Top stock picks.