
Shanghai Stocks Based on AI: Returns up to 12.0% in 3 Days
Shanghai Stocks
This forecast for Shanghai Stocks is part of the By Country Package, as one of I Know First’s algorithmic trading tools. The full forecast includes daily predictions for a total of 20 stocks with bullish and bearish signals:
- Top 10 Shanghai stocks for the long position
- Top 10 Shanghai stocks for the short position
Package Name: Shanghai Stock Forecast
Recommended Positions: Long
Forecast Length: 3 Days (8/9/2019 – 8/13/2019)
I Know First Average: 2.3%
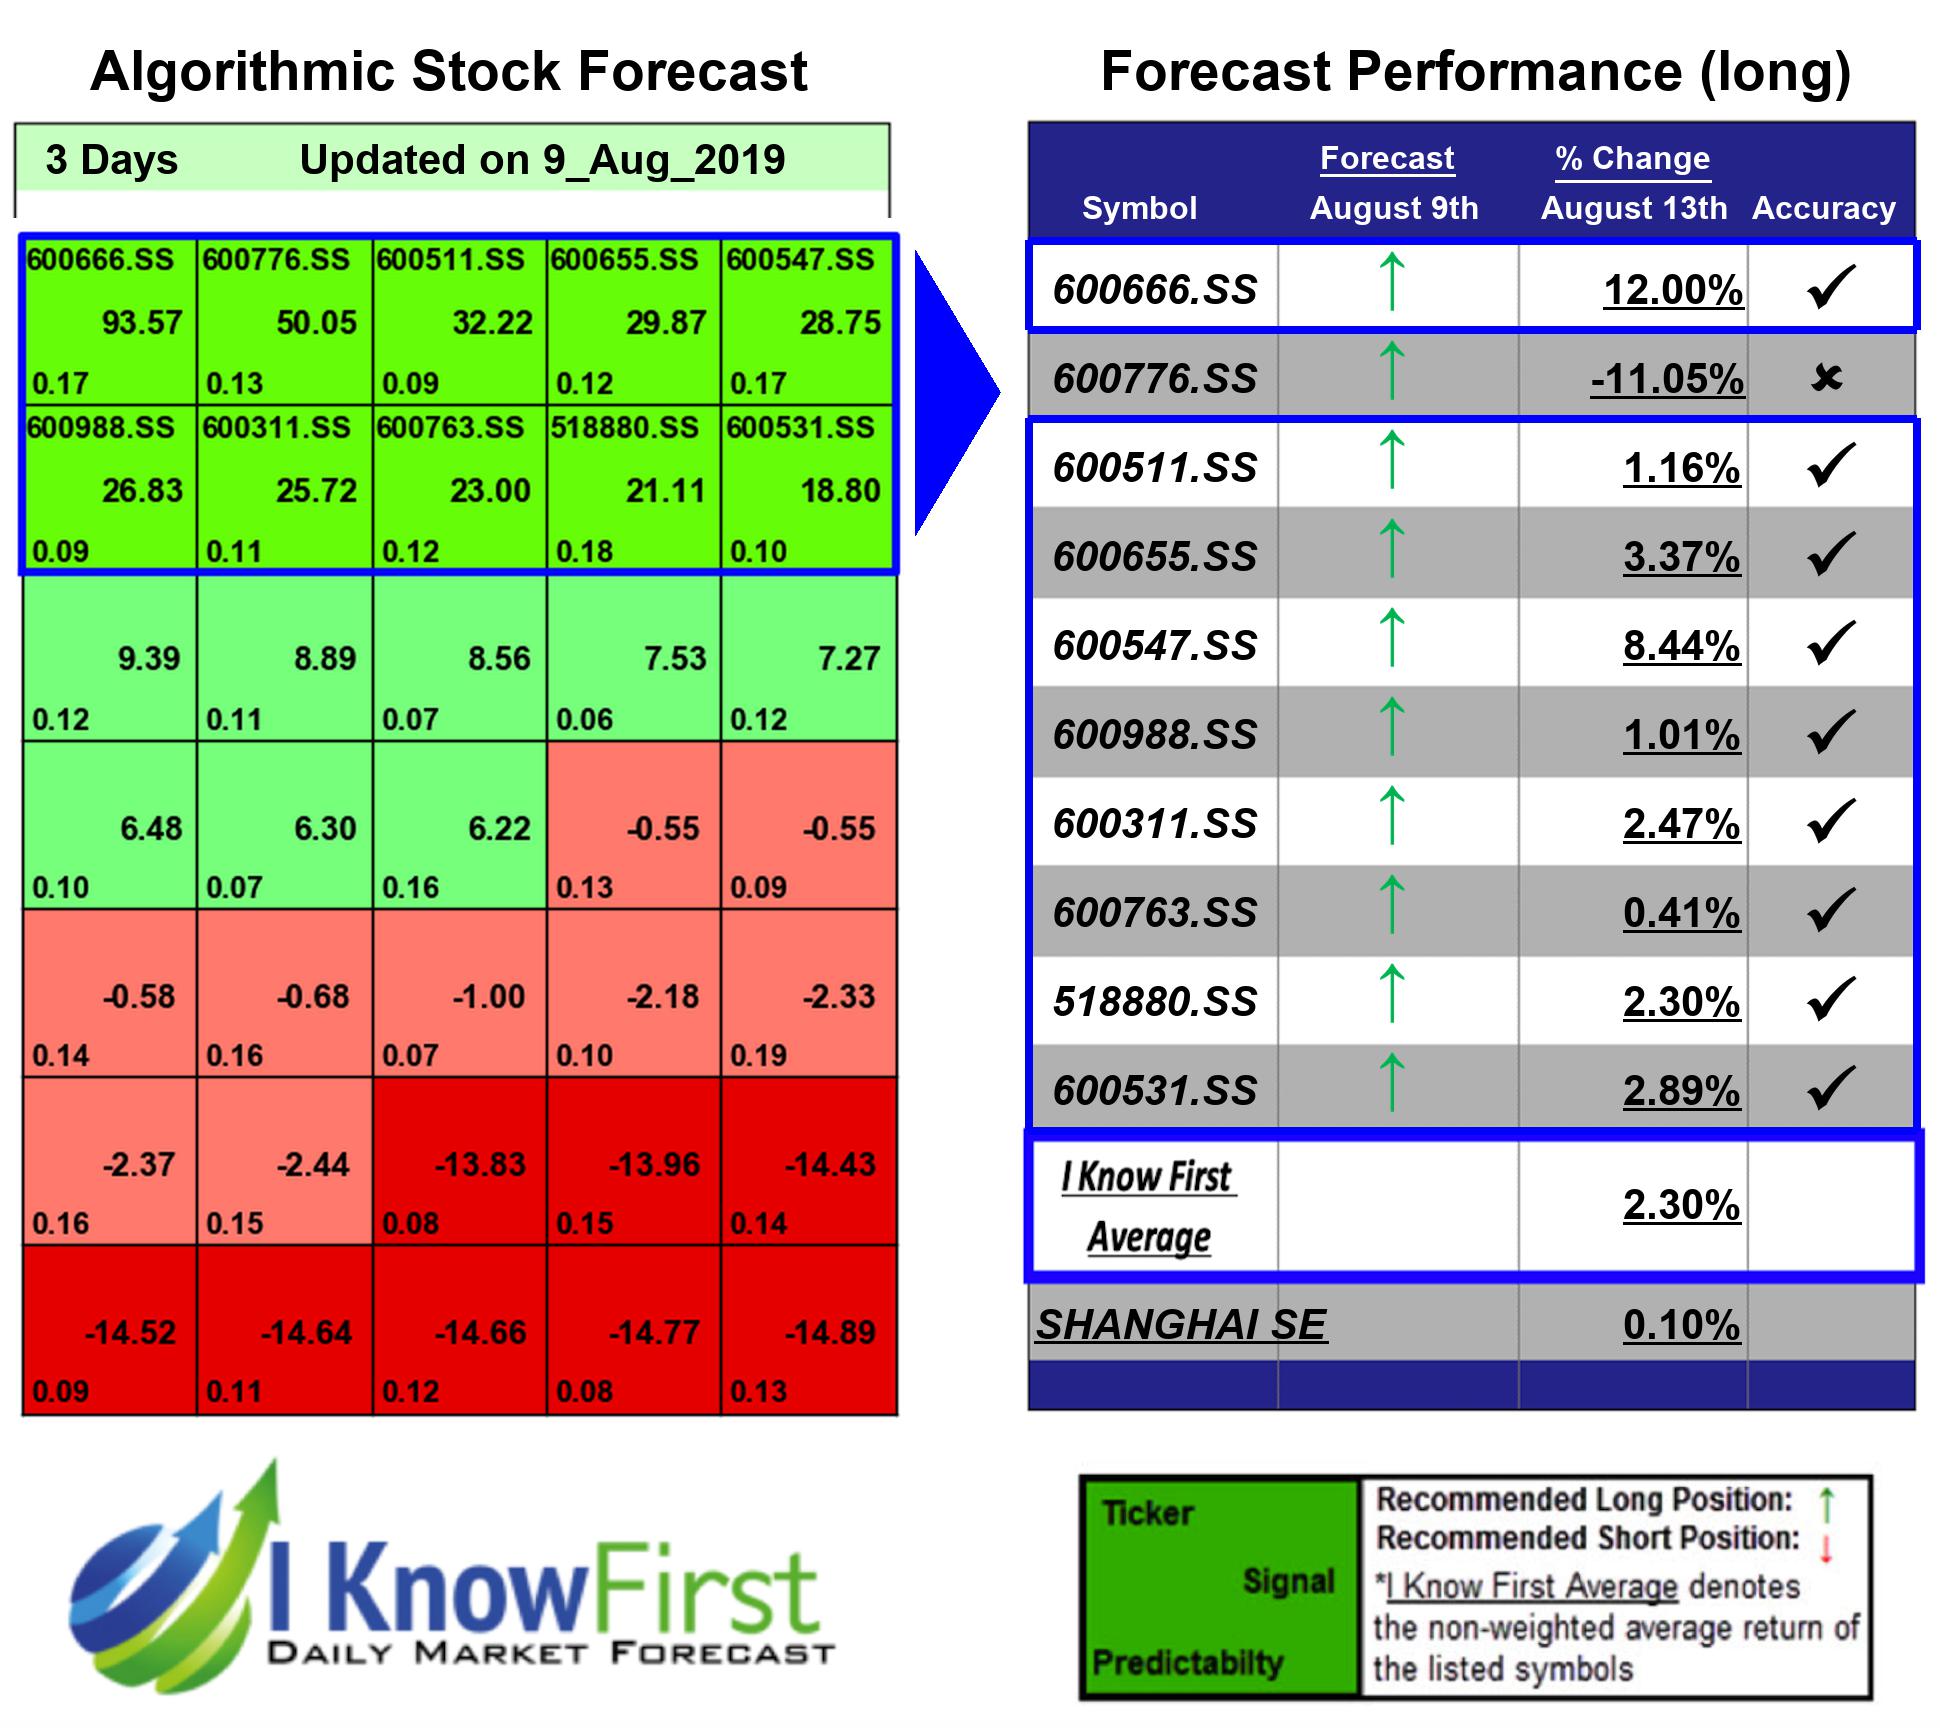
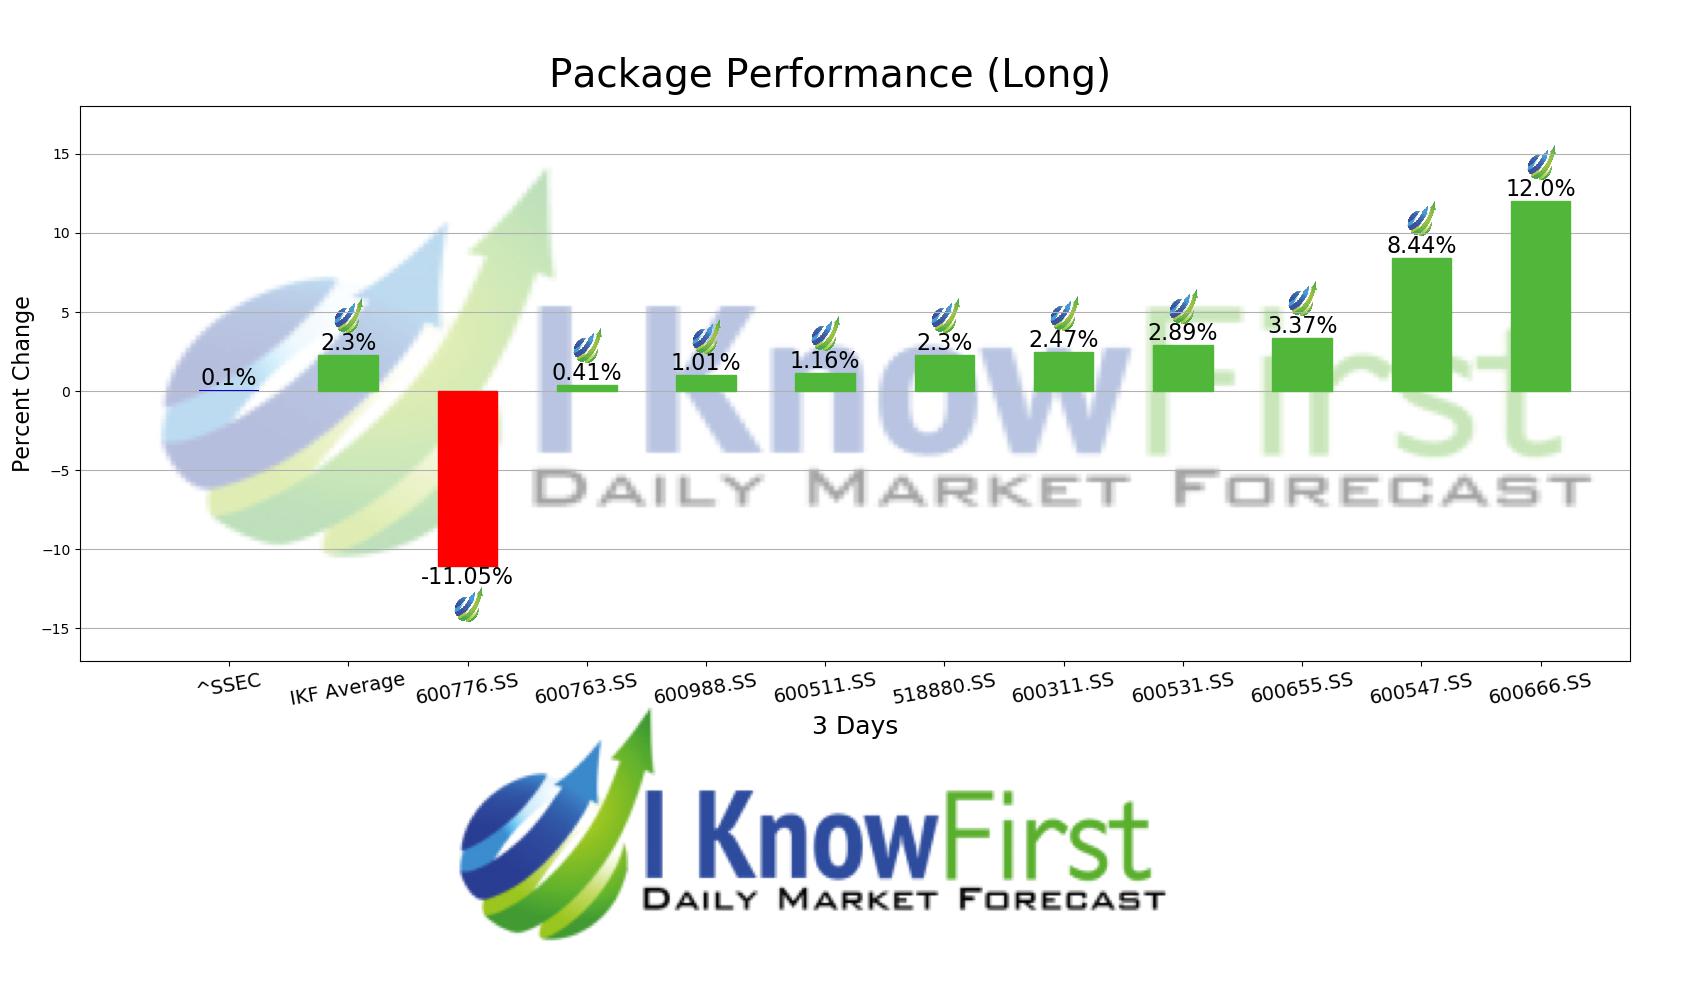
I Know First’s State of the Art Algorithm accurately forecasted 9 out of 10 trades in this Shanghai Stock Forecast Package for the 3 Days time period. The prediction with the highest return was 600666.SS, at 12.0%. 600547.SS and 600655.SS saw outstanding returns of 8.44% and 3.37%. The package had an overall average return of 2.3%, providing investors with a 2.20% premium over the SHANGHAI SE’s return of 0.1% during the period.
AURORA OPTOELECTRONICS CO., LTD, formerly SOUTHWEST PHARMACEUTICAL CO., LTD., is a China-based company, principally engaged in the research and development, manufacture and distribution of sapphire crystal materials, sapphire crystal growth equipment and sapphire products. The Company is also engaged in the research and development, manufacture and distribution of precision machining equipment for hard and brittle materials and three dimensional (3D) glass hot bending equipment. The Company conducts its businesses within domestic markets and Hongkong, Macao and Taiwan.
Algorithmic traders utilize these daily forecasts by the I Know First market prediction system as a tool to enhance portfolio performance, verify their own analysis and act on market opportunities faster. This forecast was sent to current I Know First subscribers.
How to interpret this diagram
Algorithmic Stock Forecast: The table on the left is a stock forecast produced by I Know First’s algorithm. Each day, subscribers receive forecasts for six different time horizons. Note that the top 10 stocks in the 1-month forecast may be different than those in the 1-year forecast. In the included table, only the relevant stocks have been included. The boxes are arranged according to their respective signal and predictability values (see below for detailed definitions). A green box represents a positive forecast, suggesting a long position, while a red represents a negative forecast, suggesting a short position.
Please note-for trading decisions use the most recent forecast. Get today’s forecast and Top stock picks.


