Walgreens: Fundamental, DCF, and Algorithmic Analysis
 This article was written by David Berger, a Financial Analyst at I Know First
Walgreens: Fundamental, DCF, and Algorithmic Analysis

Summary:
- Walgreens will buy over 2,186 Rite Aid stores via asset purchase agreement
- Fundamental analysis shows Walgreens will continue increasing revenue and income through the Rite Aid purchase and its improved mobile platform
- DCF analysis conservatively estimates WBA as underpriced in the stock market by about 6%
- I Know First’s algorithm projects WBA as a strong long-term buy
Walgreens Boots Alliance (NASDAQ:WBA) is an American company that owns Walgreens, Boots, and other pharmaceutical manufacturing, distribution, and wholesale companies. Walgreens specializes in health and wellness products, prescriptions, health information, and photo services. The company was fully formed on December 31, 2014 when Walgreens completed a full purchase of Swiss-based Alliance Boots after previously holding a 45% stake in the company. WBA is headquartered in Deerfield, Illinois and operates over 8,000 stores across the United States. Walgreens is the second largest U.S. pharmaceutical retailer behind CVS Health.
Walgreens to Purchase Nearly 50% of Rite Aid Stores
On Thursday, June 29, 2017, Walgreens agreed to purchase nearly half of Rite Aid’s (NYSE:RAD) total stores for $5.18 billion in cash. Walgreens will pick up 2,186 stores, three distribution centers, and related inventory from Rite Aid.Previously, Walgreens was in talks to purchase all of Rite Aid for over $9 billion. That deal fell through after the U.S. Federal Trade Commission (FTC) applied pressure for over a year.
Walgreen CEO Stefano Pessina believes that this deal is, “more attractive than the transaction it replaces”. Pessina continued, saying that, “it will allow us expand and optimize our retail pharmacy network in key markets in the U.S”. Walgreens is purchasing the stores that did not pose a competition problem based on FTC review. This should give the FTC no reason to object to this new asset purchase agreement. So in reality, this deal should work out better for Walgreens investors since there will be no further pressure applied from the FTC.
Walgreens bought distribution centers located in Connecticut, Pennsylvania, and South Carolina. Walgreens currently has distribution centers in Windsor, CT, Easton PA, and Anderson SC. Buying centers located in the same geographical area will allow Walgreens to create cost synergies. WBA can consolidate factories, lay off unneeded workers, and drive down shipping costs along the east coast. Some analysts believe this move will save WBA $400 million over the next year. With the rise of Amazon and other online pharmaceutical retailers, cutting costs is one of the most important ways to continue growing as a brick and mortar retailer.
Fundamental Analysis of Revenue and Income Growth
Even prior to the Rite Aid acquisition, WBA has experienced large revenue escalation over the past two years. Sales in 2014 were $76 billion, $103 billion in 2015, and $117 billion in 2016. This represented a rise of 35% and 13%, respectively. According to Yahoo! Finance, the average analyst estimation of revenue next year is $124.5 billion, a healthy 6.5% increase. This is in line with 2012-2014 revenue increases, and should fluctuate in the 4-6% range after another bump after the Rite Aid asset purchase materializes.
EPS and income are some of the most vital measurables used when evaluating a company via fundamental analysis. Walgreens’ EPS is one of the main reasons to get excited about its future share price. WBA’s net earnings per share (EPS) has increased at an average of 97.28% from 2014-2016. Yahoo! Finance believes WBA will have a basic EPS of 5.01 this year, a substantial boost from 3.85 in 2016. Analysts still see more growth into 2018 as well, forecasting an EPS of 5.52 in 2018. WBA’s operating income also continues to rise. In 2014, WBA operating income was $4.2 billion, $4.7 billion in 2015, and then skyrocketed to $6 billion in 2016.
DCF Analysis Shows WBA is Undervalued
Finally, to emphasize the company’s strong financials and long-term outlook, I used a discounted cash flow (DCF) model is used to yield a valuation. Essentially, a DCF model suggests a current value of a company by projecting future cash flows within it. The sum of a company’s cash flows earned in the future, discounted back to the present, is one way to determine WBA’s future stock price. Historical data, combined with an annual outlook, provide a benchmark for evaluation. However, historical data does not fully suggest all future data. It should also be stressed that projections are discretionary, and there are often estimated inputs used in the process. That being said, carefully performed DCF can aid further consideration about Walgreens’ potential. Below is the full DCF model (notice that all numbers are in millions of dollars):


In the analysis, I use an unlevered Free Cash Flow (FCF) method in which I take Earnings Before Interest and Taxes (EBIT)*(Tax Rate) + Depreciation and Amortization + Changes in Net Working Capital (NWC) – CapEX = Unlevered FCF. Then, discount that to the present using calculated Weighted Average Cost of Capital (WACC) to obtain the Present Value of the FCF. To determine the Terminal Value, which in this case is the projection of all future cash flows after 2021, Unlevered FCF *(1+Terminal Growth Rate)/(Discount Rate – Terminal Growth Rate) = Terminal Value.
Add up the NPVs of the FCFs to get the Enterprise Value of $96,339 billion. Retrieve the Equity Value by taking out WBA’s net debt, and divide that by the number of shares outstanding to get the new implied stock price of $80.62.
There are a couple of clarifications and specific line items that should be mentioned:
All financial information about WBA was pulled from numerous WBA annual reports. In determining the Cost of Capital, the CAP-M method was used. The Risk-Free Rate Market Risk Premium were pulled from the U.S. Treasury website and KPMG studies. Beta was calculated by taking an average of WBA’s historical Beta and individual Betas from the past few years.
Furthermore, the projected share price of $80.62 results in an upside 4.08% from the current share price. While that may not seem like that significant of a devaluation by the market, conservative revenue and (EBIT) margins were used in this DCF. Projecting revenue spikes between 5-6%, and 2018 revenue at 9% is a bit low since Walgreens just acquired $15 billion worth of stores from Rite Aid. Additionally, WBA has raised revenue by double digits the past two years, so there is a possibility that Walgreens sees a similar trend at some point over the next five years.
Moreover, my DCF projection falls into line with other analyst predictions. Out of 25 analysts, 18 concluded WBA to be a Strong Buy or Buy for the past three months. Even my price target falls on the more conservative end, well below the average stock price prediction of $92.24. Many of my calculations are more cautious than fellow analysts, so there is an even greater chance that the stock price will rise above my valuation of $80.62.

(Source: Yahoo Finance)
Algorithmic Analysis:
My bullish forecast for WBA in the long-run is echoed by the I Know First algorithmic forecast from July 9:
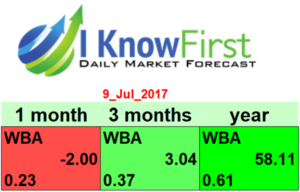
The bearish short-term forecast can be explained by the news that the Rite Aid purchase was for fewer stores than expected. But once the synergies begin to hold, WBA’s price will shoot up.
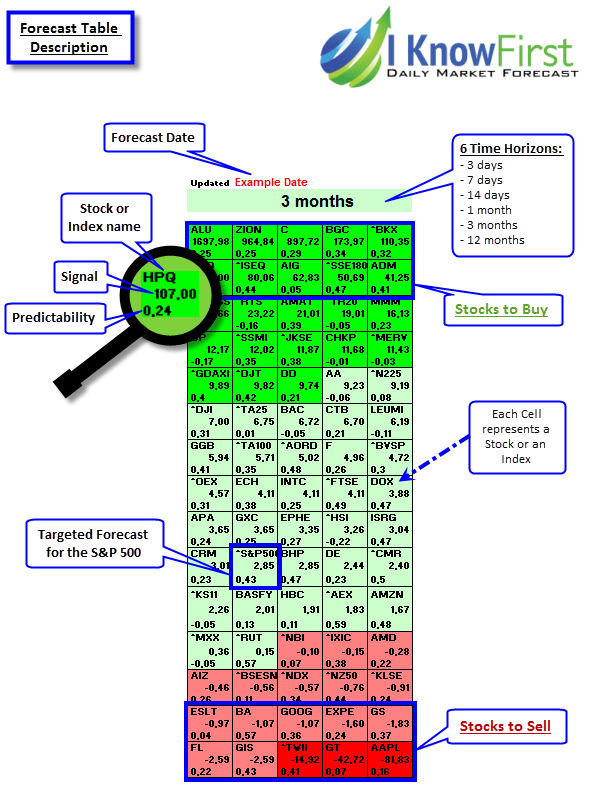
I Know First Algorithm Heatmap Explanation
The sign of the signal tells in which direction the asset price is expected to go (positive = to go up = Long, negative = to drop = Short position), the signal strength is related to the magnitude of the expected return and is used for ranking purposes of the investment opportunities.
Predictability is the actual fitness function being optimized every day, and can be simplified explained as the correlation based quality measure of the signal. This is a unique indicator of the I Know First algorithm. This allows users to separate and focus on the most predictable assets according to the algorithm. Ranging between -1 and 1, one should focus on predictability levels significantly above 0 in order to fill confident about/trust the signal.