
TJX Stock Analysis: The U.S. Retailer Might Be A Bargain

This Article was written by Anna Latini, a Financial Analyst at I Know First
TJX Stock Analysis
Summary:
- A Bright Spot In The Clouds Of U.S Retail
- What makes TJX different?
- Why it is time to buy TJX stock
- DCF Analysis and Explanation
A Bright Spot In The Clouds Of U.S Retail
TJX Companies, the parent company of retailers T.J. Maxx, Marshalls, and HomeGoods are leading off price apparel and home fashions retailers in the U.S and worldwide.
They sell a rapidly changing variety of merchandise at prices that are usually 20% to 60% below department and specialty store regular prices on comparable products. The company operates more than 3,800 stores through their four main segments: in the U.S., Marmaxx and HomeGoods; TJX Canada (which operates Winners, HomeSense and Marshalls in Canada); and TJX International, (which operates T.K. Maxx, HomeSense and tkmaxx.com in Europe, and Trade Secret in Australia). In the U.S., they also operate Sierra Trading Post (STP), an off-price Internet retailer with a small number of stores.

Source: BBC News
What Makes TJX Different?
While many major U.S retailers as Macy’s, J.C Penny and Target are going through thug times, shutting down stores and reporting decreasing sales, mainly due to strong competition from online giant Amazon, TJX Companies seems to be almost Amazon-proof. The company indeed kept reporting sale increases and store enlargements in the past few years.
But what makes its strategy different from its competitors? The core of TJX success seems to be its ability to continuously renovate its inventory, thus adjusting to costumers’ rapidly changing preferences. The way they do so is through a tremendously wide network of about 18,000 vendors and more than 1,000 buyers, numbers that are way above all of its main competitors’. These assets give them the possibility to adapt each store merchandise to local preferences, buy a large variety of brands in different quantities and offer nearly endless choices to costumers.
In store experience is often described as a sort of “treasure hunt” and this feeling is something consumers seem to appreciate, something that online competitors cannot replicate. I believe here lies the company’s biggest strength.

Why It Is Time To Buy TJX Stock
2016 was another successful year for TJX. It posted strong growth in net sales and solid earnings per share increase. This came on top of its strong upward trend of both fiscal 2016 and fiscal 2015. The company continued to return value to shareholders through cash dividends and share repurchases. Furthermore, they kept reinvesting in their business by adding new stores and remodeling existing ones.
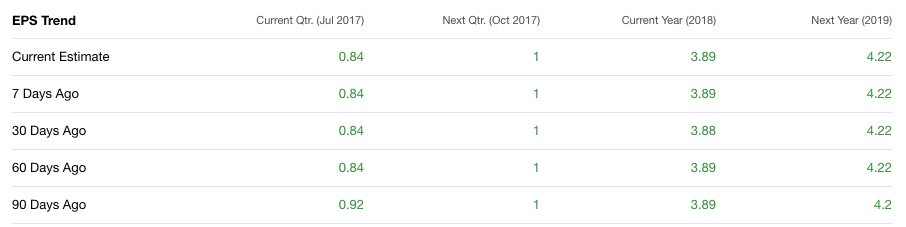
According to Yahoo Finance, analysts are estimating positive EPS growth in the next two years, with an EPS reaching 4.22 in 2019 from the current value of 0.84. Growth for the next five years is projected at around 10% on average, thus the company is estimated to gain momentum given that growth in the past 5 years was around 8% per annum.
With that said, looking at TJX share price performance, something seems a bit off. The stock is currently selling at $70.30, down by almost $10 from the same day last year. To explain this trend, we have to take a step back and focus on the industry. Investors are clearly fearing the retail sector in general. They lost confidence in its ability to deliver, thus they are fleeing from it. However, such fears have not materialized in the case of TJX Companies yet, and I believe they will not in the near future either. Chances are, the company will continue to produce great results and thus its shares are currently selling at a discount.
DCF Analysis and Explanation
To support my point, I have performed a DCF analysis on the company.
With a DCF analysis it’s possible to get to the current value of a company by projecting future cash flows. The sum of a company’s cash flows earned in the future, discounted back to the present, is one way to determine a company future stock price. It should be underlined that projections are discretionary, and there are many estimated inputs in the process, however, carefully executed DCF can bring further evidence of TJX potential.
Below is the full DCF model (notice that all numbers are in millions of dollars):
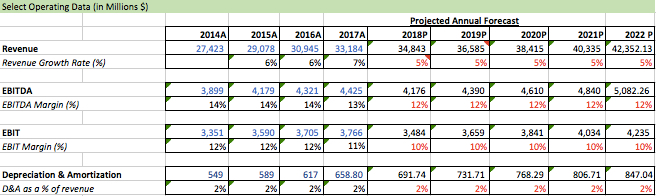

In the analysis, I used the unlevered Free Cash Flow (FCF) method where I take Earnings Before Interest and Taxes (EBIT)*(Tax Rate) + Depreciation and Amortization + Changes in Net Working Capital (NWC) – CapEX = Unlevered
FCF. Then, discount that to the present using calculated Weighted Average Cost of Capital (WACC) to obtain the Present Value of the FCF. To determine the Terminal Value, which in this case is the projection of all future cash flows after 2022, Unlevered FCF *(1+Terminal Growth Rate)/(Discount Rate – Terminal Growth Rate) = Terminal Value. Add up the NPVs of the FCFs to get the total

Enterprise Value of $61,190 billion. I take out TJX’s net debt to get to the Equity Value and I divide that by the number of shares outstanding to get the new implied stock price.
There are a couple of clarifications and specific line items that should be mentioned:
All financial information was taken from numerous TJX annual reports. In determining the Cost of Capital I used the CAP-M method. The Risk-Free Rate was pulled from the U.S. Treasury website and the market risk premium was taken from a study conducted by KPMG. Beta was calculated by taking an average of TJX’s historical Beta and individual Betas from the past few years.
The projected share price of $85.11 represents a 21.07% upside from the current share price of $70.3 signaling the stock is significantly devalued. I have used slightly conservative revenue and EBIT margins as I projected revenue growth, with the former at 5% per annum while most analysts’ expectations are around the 6% mark.
My buying recommendation that comes out from this DCF analysis is in line with other analyst estimates. Out of 29 indeed, around 7 deemed TJX as a strong buy and 15 as a buy during the past three months. The price target also falls in the range, just slightly above the average estimate that equals $84.29, on a scale where the most optimistic valuation goes as far as $97.
I Know First Forecast
On July 23, our algorithm issued a bullish forecast for the stock both in the short and long term with a strong signal especially for the 1 year horizon. We recall in the past I Know First had already successfully predicted TJX performance. On January 17, 2016 the algorithm issued a bullish forecast for the 14 days time horizon and indeed the stock gained more than 5% in the following days.

I Know First Algorithm Heatmap Explanation
The sign of the signal tells in which direction the asset price is expected to go (positive = to go up = Long, negative = to drop = Short position), the signal strength is related to the magnitude of the expected return and is used for ranking purposes of the investment opportunities.
Predictability is the actual fitness function being optimized every day, and can be simplified explained as the correlation based quality measure of the signal. This is a unique indicator of the I Know First algorithm. This allows users to separate and focus on the most predictable assets according to the algorithm. Ranging between -1 and 1, one should focus on predictability levels significantly above 0 in order to fill confident about/trust the signal.


