
Real Estate Stocks Based on Artificial Intelligence: Returns up to 18.61% in 3 Months
Real Estate Stocks
This Real Estate Stocks forecast is designed for investors and analysts who need predictions for the best stocks to invest in the real estate sector (see Real Estate Stocks Package). It includes 20 stocks with bullish and bearish signals:
- Top 10 Real Estate stocks for the long position
- Top 10 Real Estate stocks for the short position
![]()
![]()
Package Name: Real Estate Stock Forecast
Recommended Positions: Long
Forecast Length: 3 Months (7/2/2019 – 10/2/2019)
I Know First Average: 6.97%
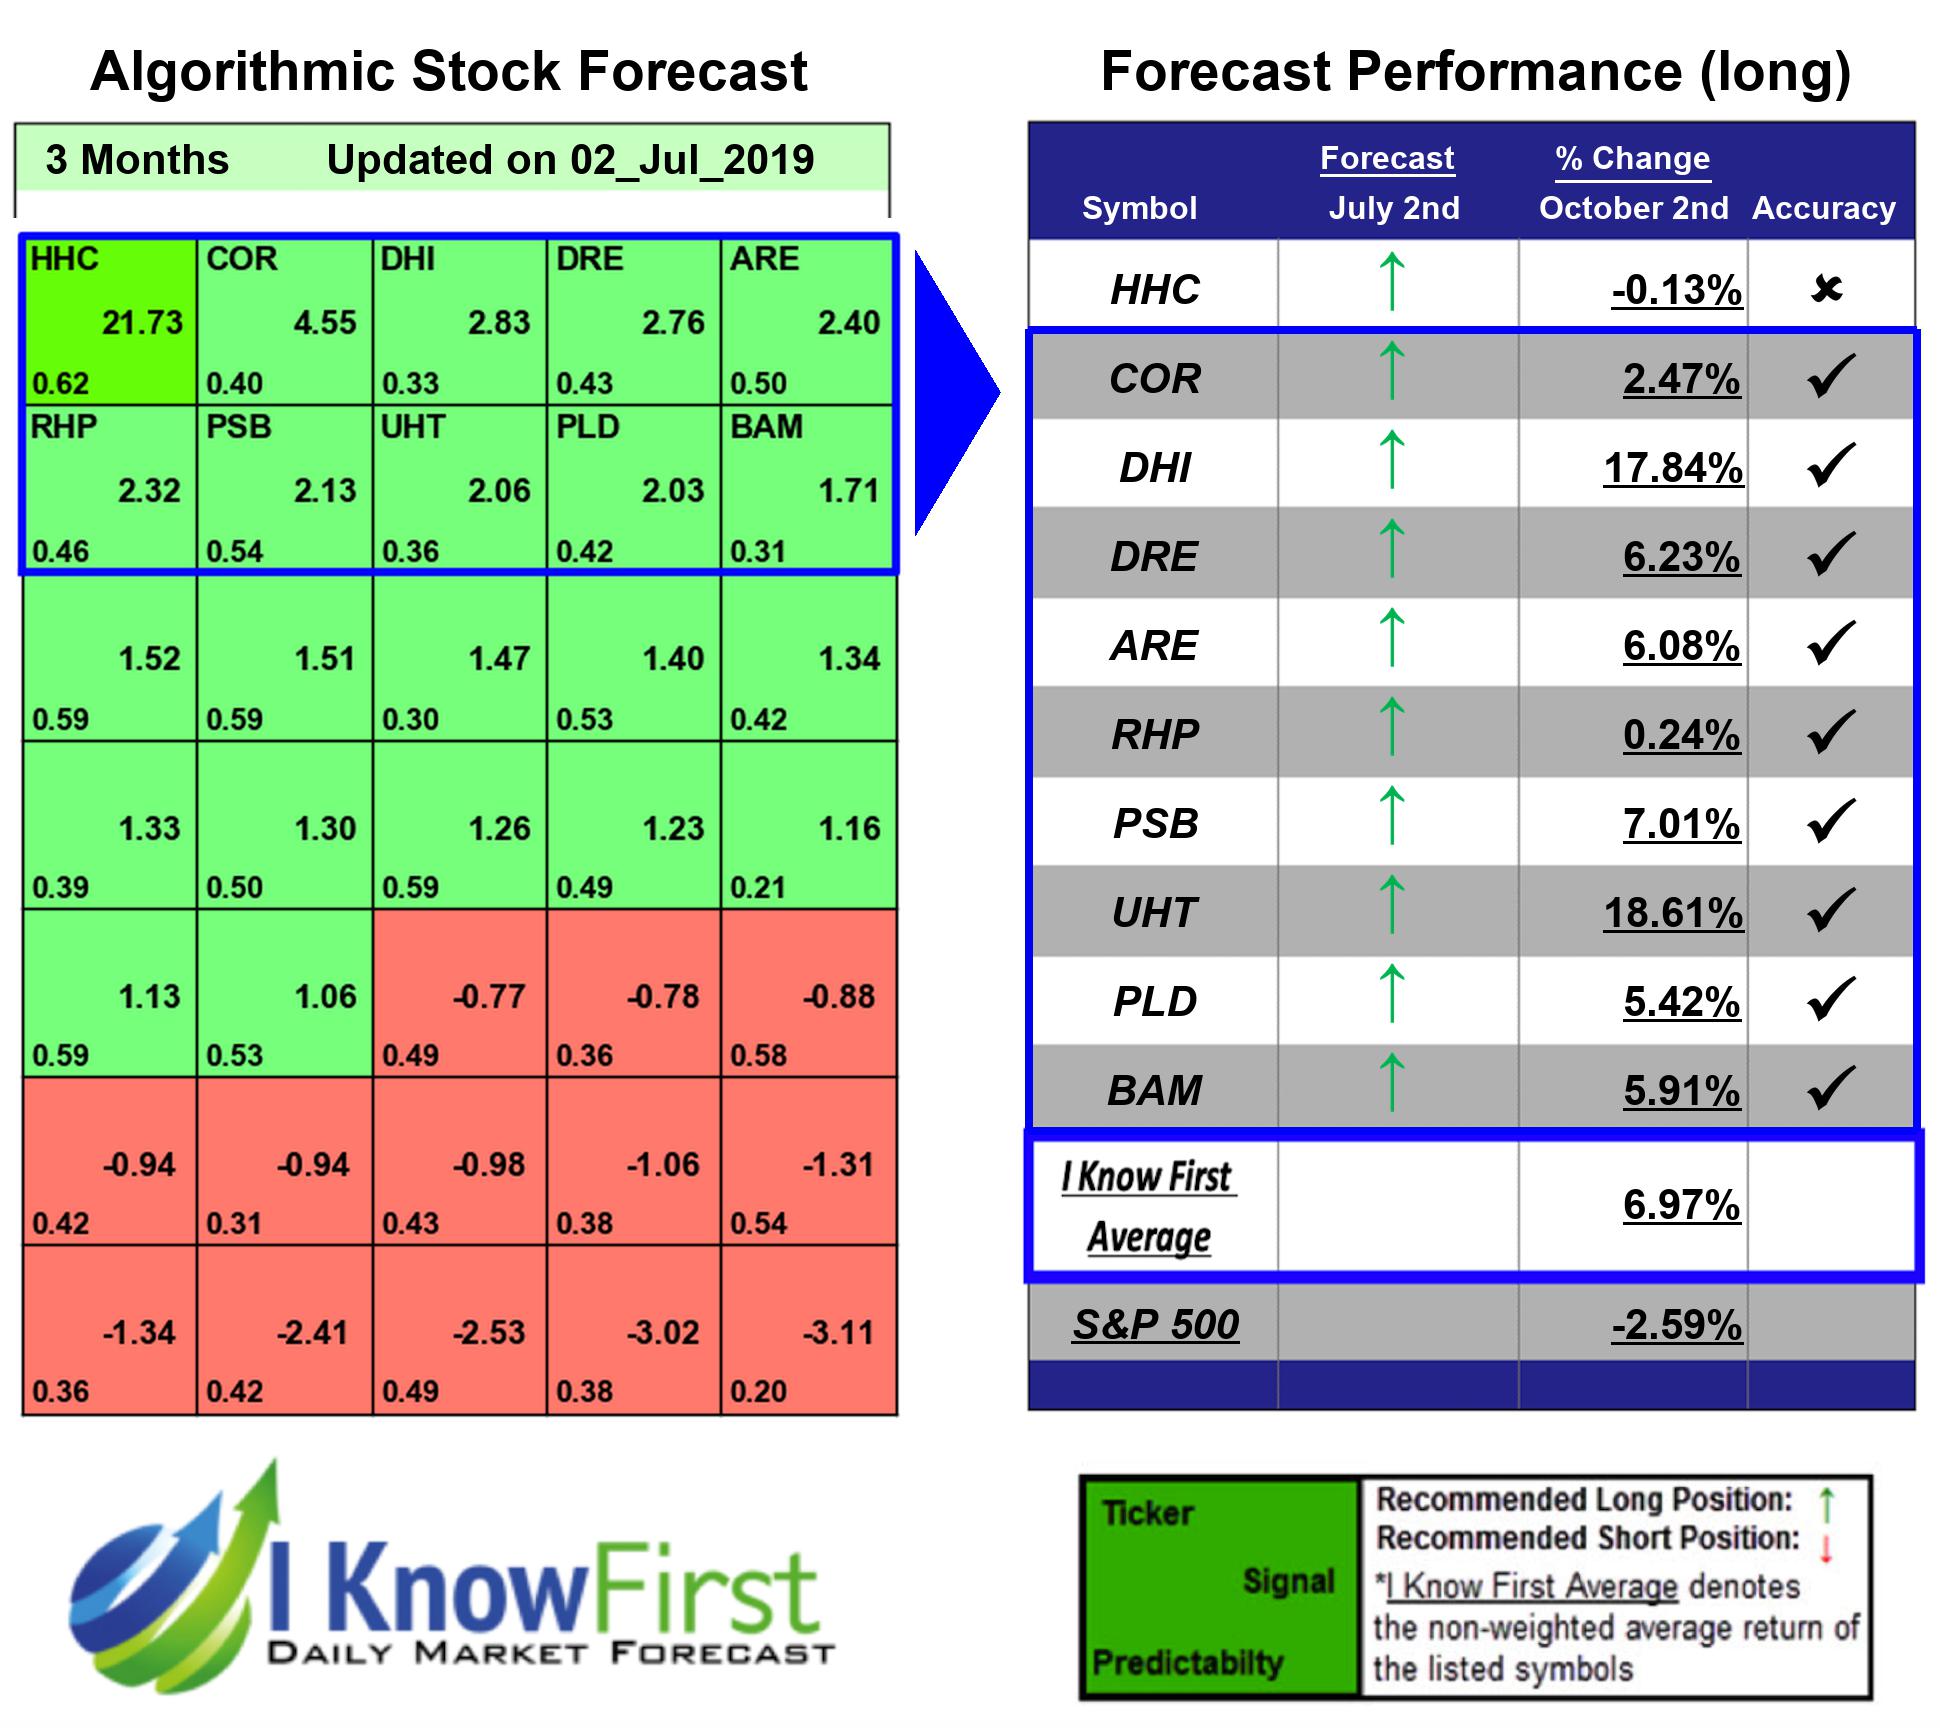
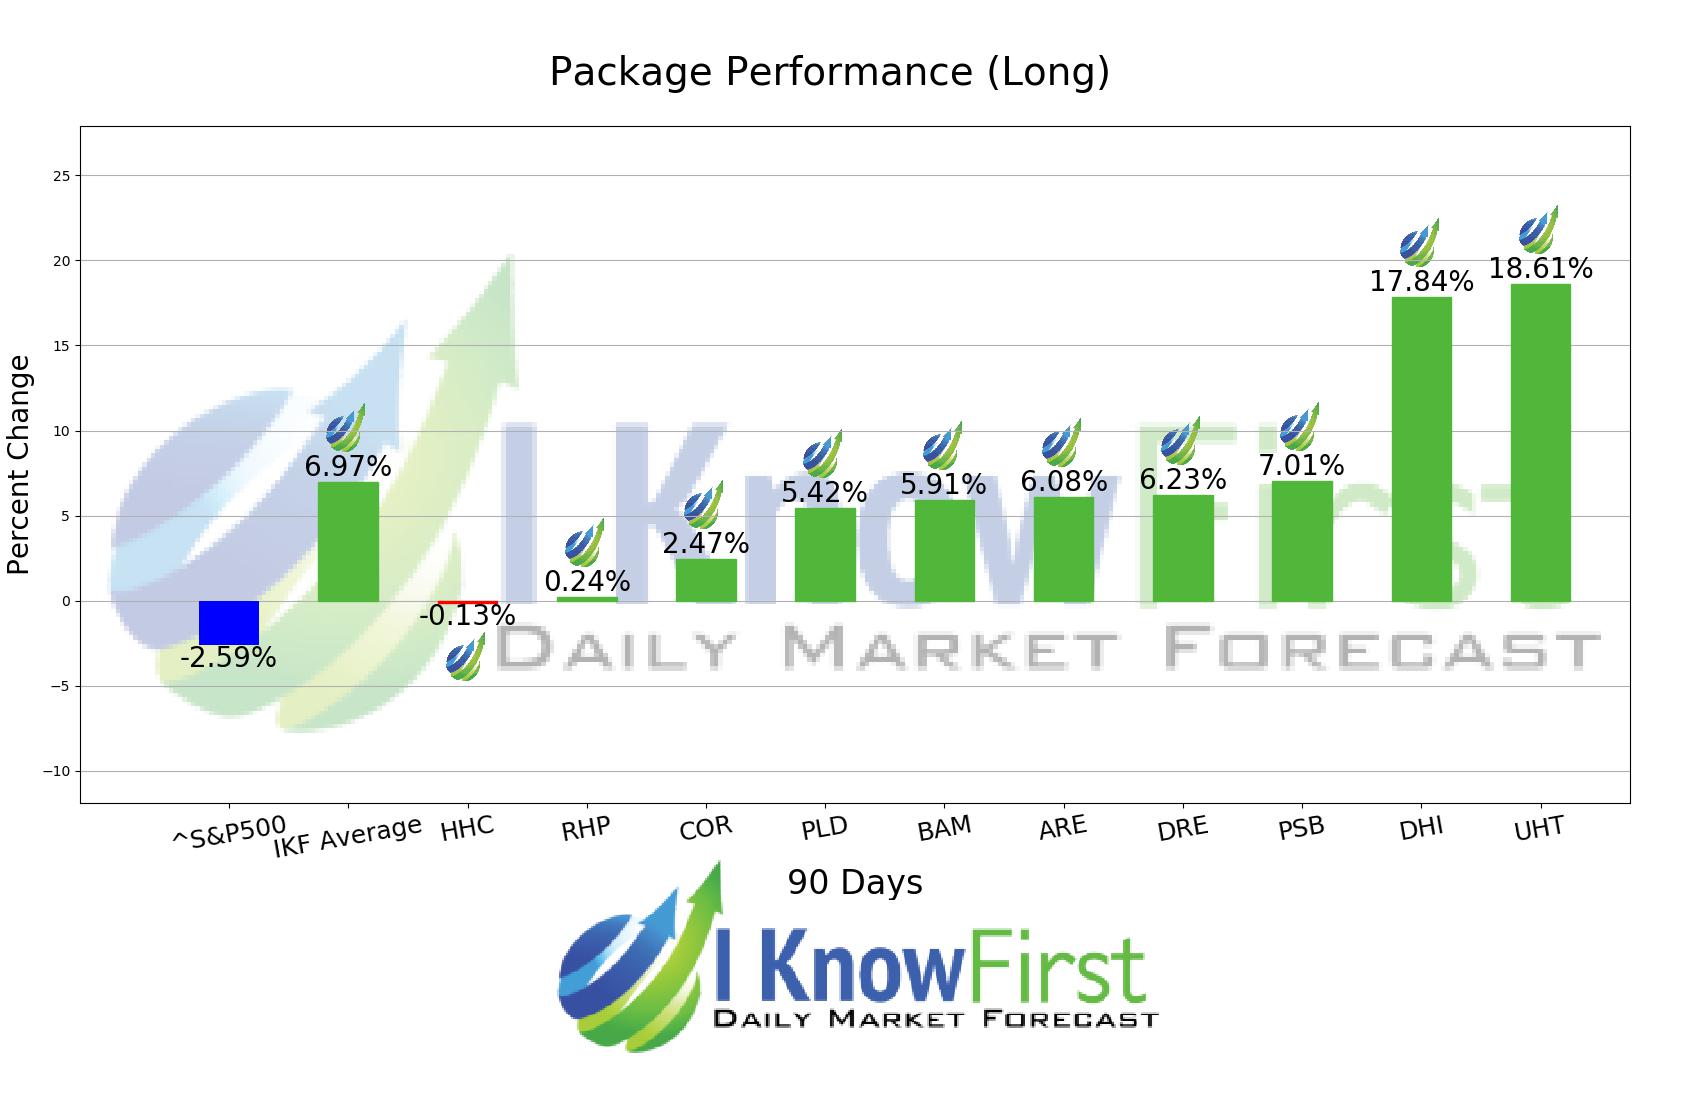
In this 3 Months forecast for the Real Estate Stock Forecast Package, there were many high performing trades and the algorithm correctly predicted 9 out 10 trades. UHT was the highest-earning trade with a return of 18.61% in 3 Months. Further notable returns came from DHI and PSB at 17.84% and 7.01%, respectively. This algorithmic forecast package presented an overall return of 6.97% versus S&P 500’s performance of -2.59% providing a market premium of 9.56%.
Universal Health Realty Income Trust (UHT) is a publicly owned real estate investment trust. The firm invests in the real estate markets of United States. It invests in the health care and human service related facilities including acute care hospitals, behavioral healthcare facilities, rehabilitation hospitals, sub-acute facilities, surgery centers, childcare centers, and medical office buildings. Universal Health Realty Income Trust (UHT) was founded in 1986, and is based in King of Prussia, Pennsylvania.
Algorithmic traders utilize these daily forecasts by the I Know First market prediction system as a tool to enhance portfolio performance, verify their own analysis and act on market opportunities faster. This forecast was sent to current I Know First subscribers.
How to interpret this diagram
Algorithmic Stock Forecast: The table on the left is a stock forecast produced by I Know First’s algorithm. Each day, subscribers receive forecasts for six different time horizons. Note that the top 10 stocks in the 1-month forecast may be different than those in the 1-year forecast. In the included table, only the relevant stocks have been included. The boxes are arranged according to their respective signal and predictability values (see below for detailed definitions). A green box represents a positive forecast, suggesting a long position, while a red represents a negative forecast, suggesting a short position.
Please note-for trading decisions use the most recent forecast. Get today’s forecast and Top stock picks.


