
Quick Win by the Algorithm: VNR High Volatility Expectations Succeed
Quick Win by the Algorithm
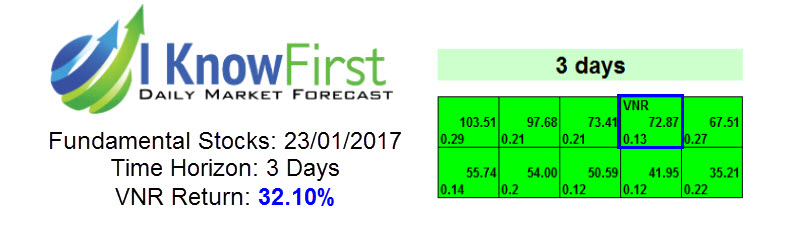
On January 23, 2017, the I Know First algorithm had predicted a bullish forecast for Vanguard Natural Resources LLC, Inc. (VNR). It had a signal of 72.87 and a predictability of 0.13. In accordance with the algorithm, the company reported gains of 32.10% experiencing a quick win by the algorithm.
Vanguard Natural Resources LLC. is an independent natural gas and oil company. The Company develops and exploits mature, long-lived natural gas and oil properties. Vanguard’s primary business objective is to generate stable cash flows allowing them to make monthly cash distributions to our unitholders.

On July 21st, investors in Vanguard Natural Resources, LLC VNR needed to pay close attention to the stock based on moves in the options. That is because a $2 Call had some of the highest implied volatility of all equity options.
Implied volatility shows how much movement the market is expecting in the future. Options with high levels of implied volatility suggest that investors in the underlying stocks are expecting a big move in one direction or the other. It could also mean there is an event coming up soon that may cause a big rally or a huge sell off.
Given the way analysts felt about Vanguard, this huge implied volatility meant that there could be a big trade developing. Also, the fundamental picture for the company was favorable to the bullish forecast: Vanguard was a Zacks Rank #2 (Buy) in the Oil and Gas – Exploration and Production – United States industry that ranks in the Top 12% of Zacks Industry Rank. Clearly, these expectations consolidated in what was a big rally to VNR’s stock and matching the prediction of the algorithm.
This bullish forecast on VNR was sent to current I Know First subscribers on January 23, 2017.
Before making any trading decisions, consult the latest forecast as the algorithm constantly updates predictions daily. While the algorithm can be used for intra-day trading the predictability tends to become stronger with forecasts over longer time-horizons such as the 1-month, 3-month and 1-year forecasts.
How to interpret this diagram
Missed the latest trend? Looking for the next best market opportunity? Find out today’s stock forecast based on our advanced self-learning algorithm


