
Quantitative Trading Based on Deep-Learning: Returns up to 7.38% in 3 Days
Quantitative Trading
The Computer Industry Stocks Package is designed for investors and analysts who need quantitative trading predictions of the best-performing stocks for the whole Computer Industry. It includes 20 stocks with bullish and bearish signals and indicates the best stocks to buy in the computer industry:
- Top 10 Computer Industry stocks for the long position
- Top 10 Computer Industry stocks for the short position

Package Name: Computer Industry
Recommended Positions: Long
Forecast Length: 3 Days (1/5/2020 – 1/8/2020)
I Know First Average: 2.93%

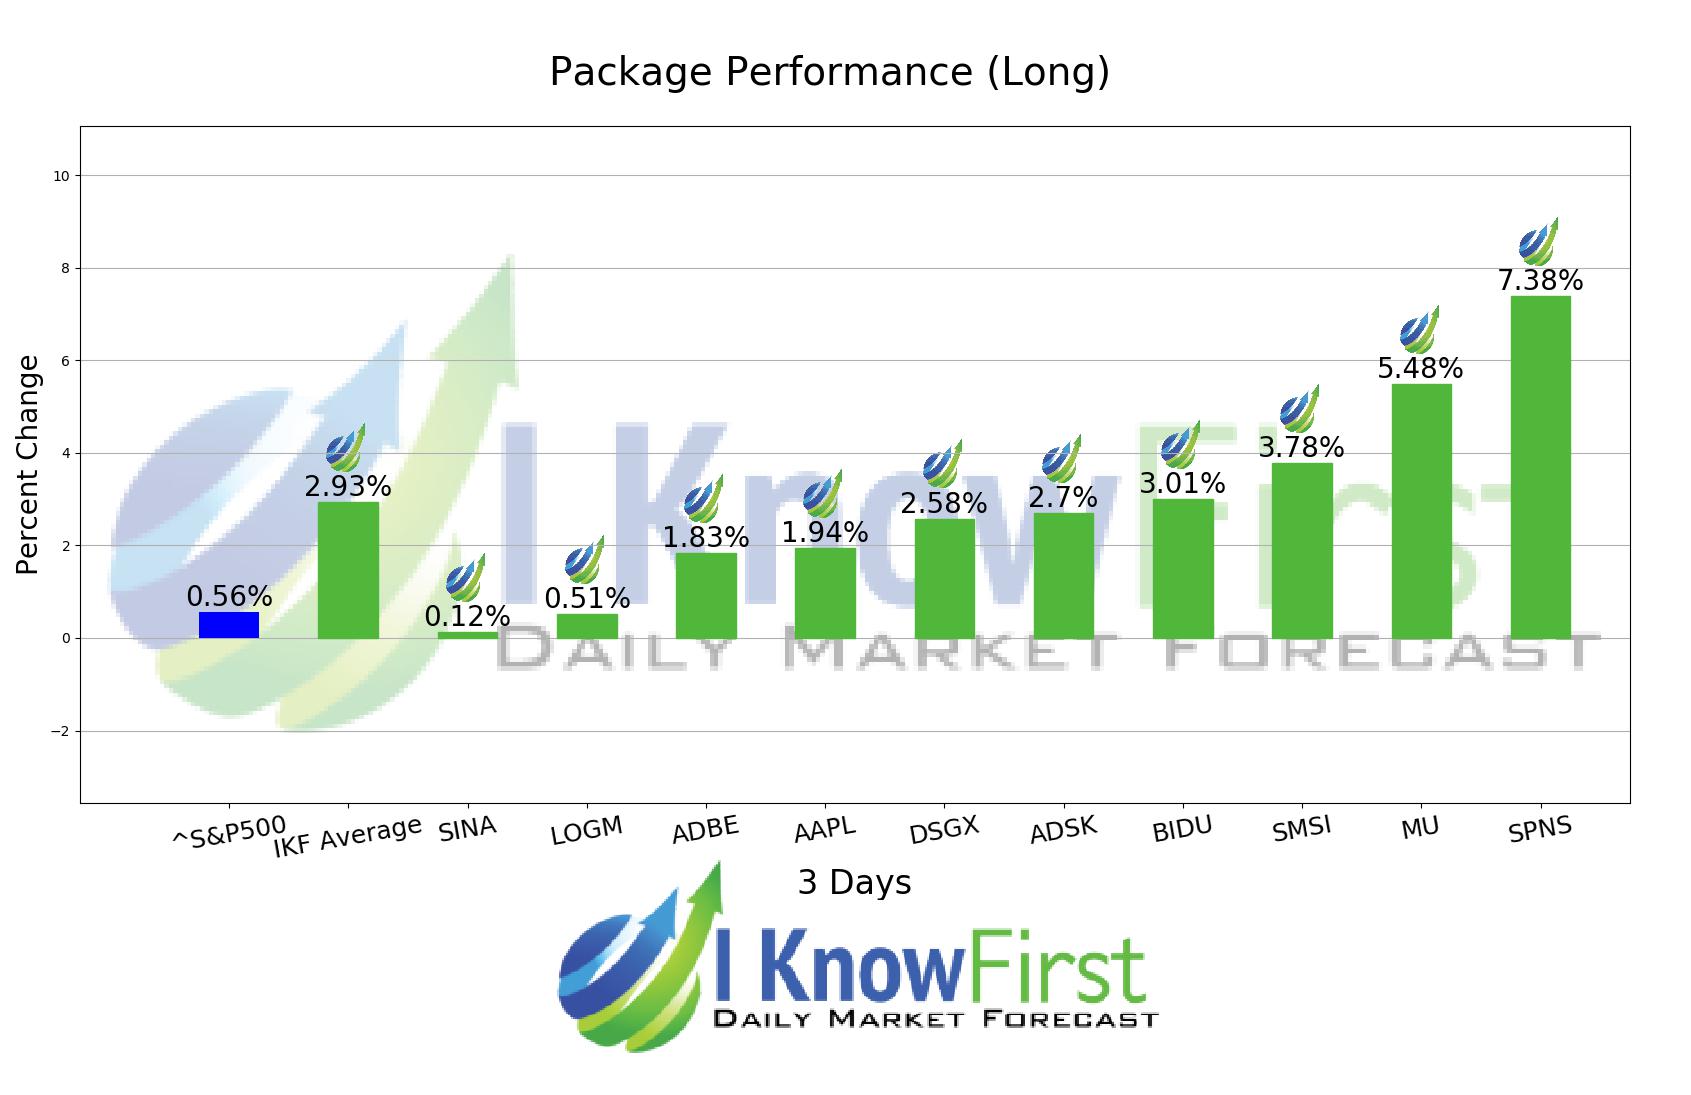
For this 3 Days forecast the algorithm had successfully predicted 10 out of 10 movements. SPNS was the highest-earning trade with a return of 7.38% in 3 Days. The suggested trades for MU and SMSI also had notable 3 Days yields of 5.48% and 3.78%, respectively. The package itself saw an overall return of 2.93%, providing investors with a 2.37% premium above the S&P 500’s return of 0.56% for the same time period.
Sapiens International Corporation N.V. (Sapiens), incorporated on April 6, 1990, is a provider of software solutions for the insurance industry, with a focus on the financial services sector. The Company operates in provider of software solutions segment. The Company offers its software solutions for providers of Property & Casualty/General Insurance (P&C), and Life, Annuities and Pensions Insurance (L&P), enabling its customers to manage their core business functions, including policy administration, claims management and billing. It also supplies core record-keeping software solutions for providers of Retirement Services and Reinsurance. It offers a platform that enables its customers to deploy business logic and comply with policies and regulations across their organizations.
Algorithmic traders utilize these daily forecasts by the I Know First market prediction system as a tool to enhance portfolio performance, verify their own analysis and act on market opportunities faster. This forecast was sent to current I Know First subscribers.
How to interpret this diagram
Algorithmic Stock Forecast: The table on the left is a stock forecast produced by I Know First’s algorithm. Each day, subscribers receive forecasts for six different time horizons. Note that the top 10 stocks in the 1-month forecast may be different than those in the 1-year forecast. In the included table, only the relevant stocks have been included. The boxes are arranged according to their respective signal and predictability values (see below for detailed definitions). A green box represents a positive forecast, suggesting a long position, while a red represents a negative forecast, suggesting a short position.
Please note-for trading decisions use the most recent forecast. Get today’s forecast and Top stock picks.


