
Quantitative Trading Based on Big Data Analytics: Returns up to 23.77% in 14 Days
Quantitative Trading
The Computer Industry Stocks Package is designed for investors and analysts who need quantitative trading predictions of the best-performing stocks for the whole Computer Industry. It includes 20 stocks with bullish and bearish signals and indicates the best stocks to buy in the computer industry:
- Top 10 Computer Industry stocks for the long position
- Top 10 Computer Industry stocks for the short position

Package Name: Computer Industry
Recommended Positions: Long
Forecast Length: 14 Days (5/15/2020 – 5/30/2020)
I Know First Average: 8.42%
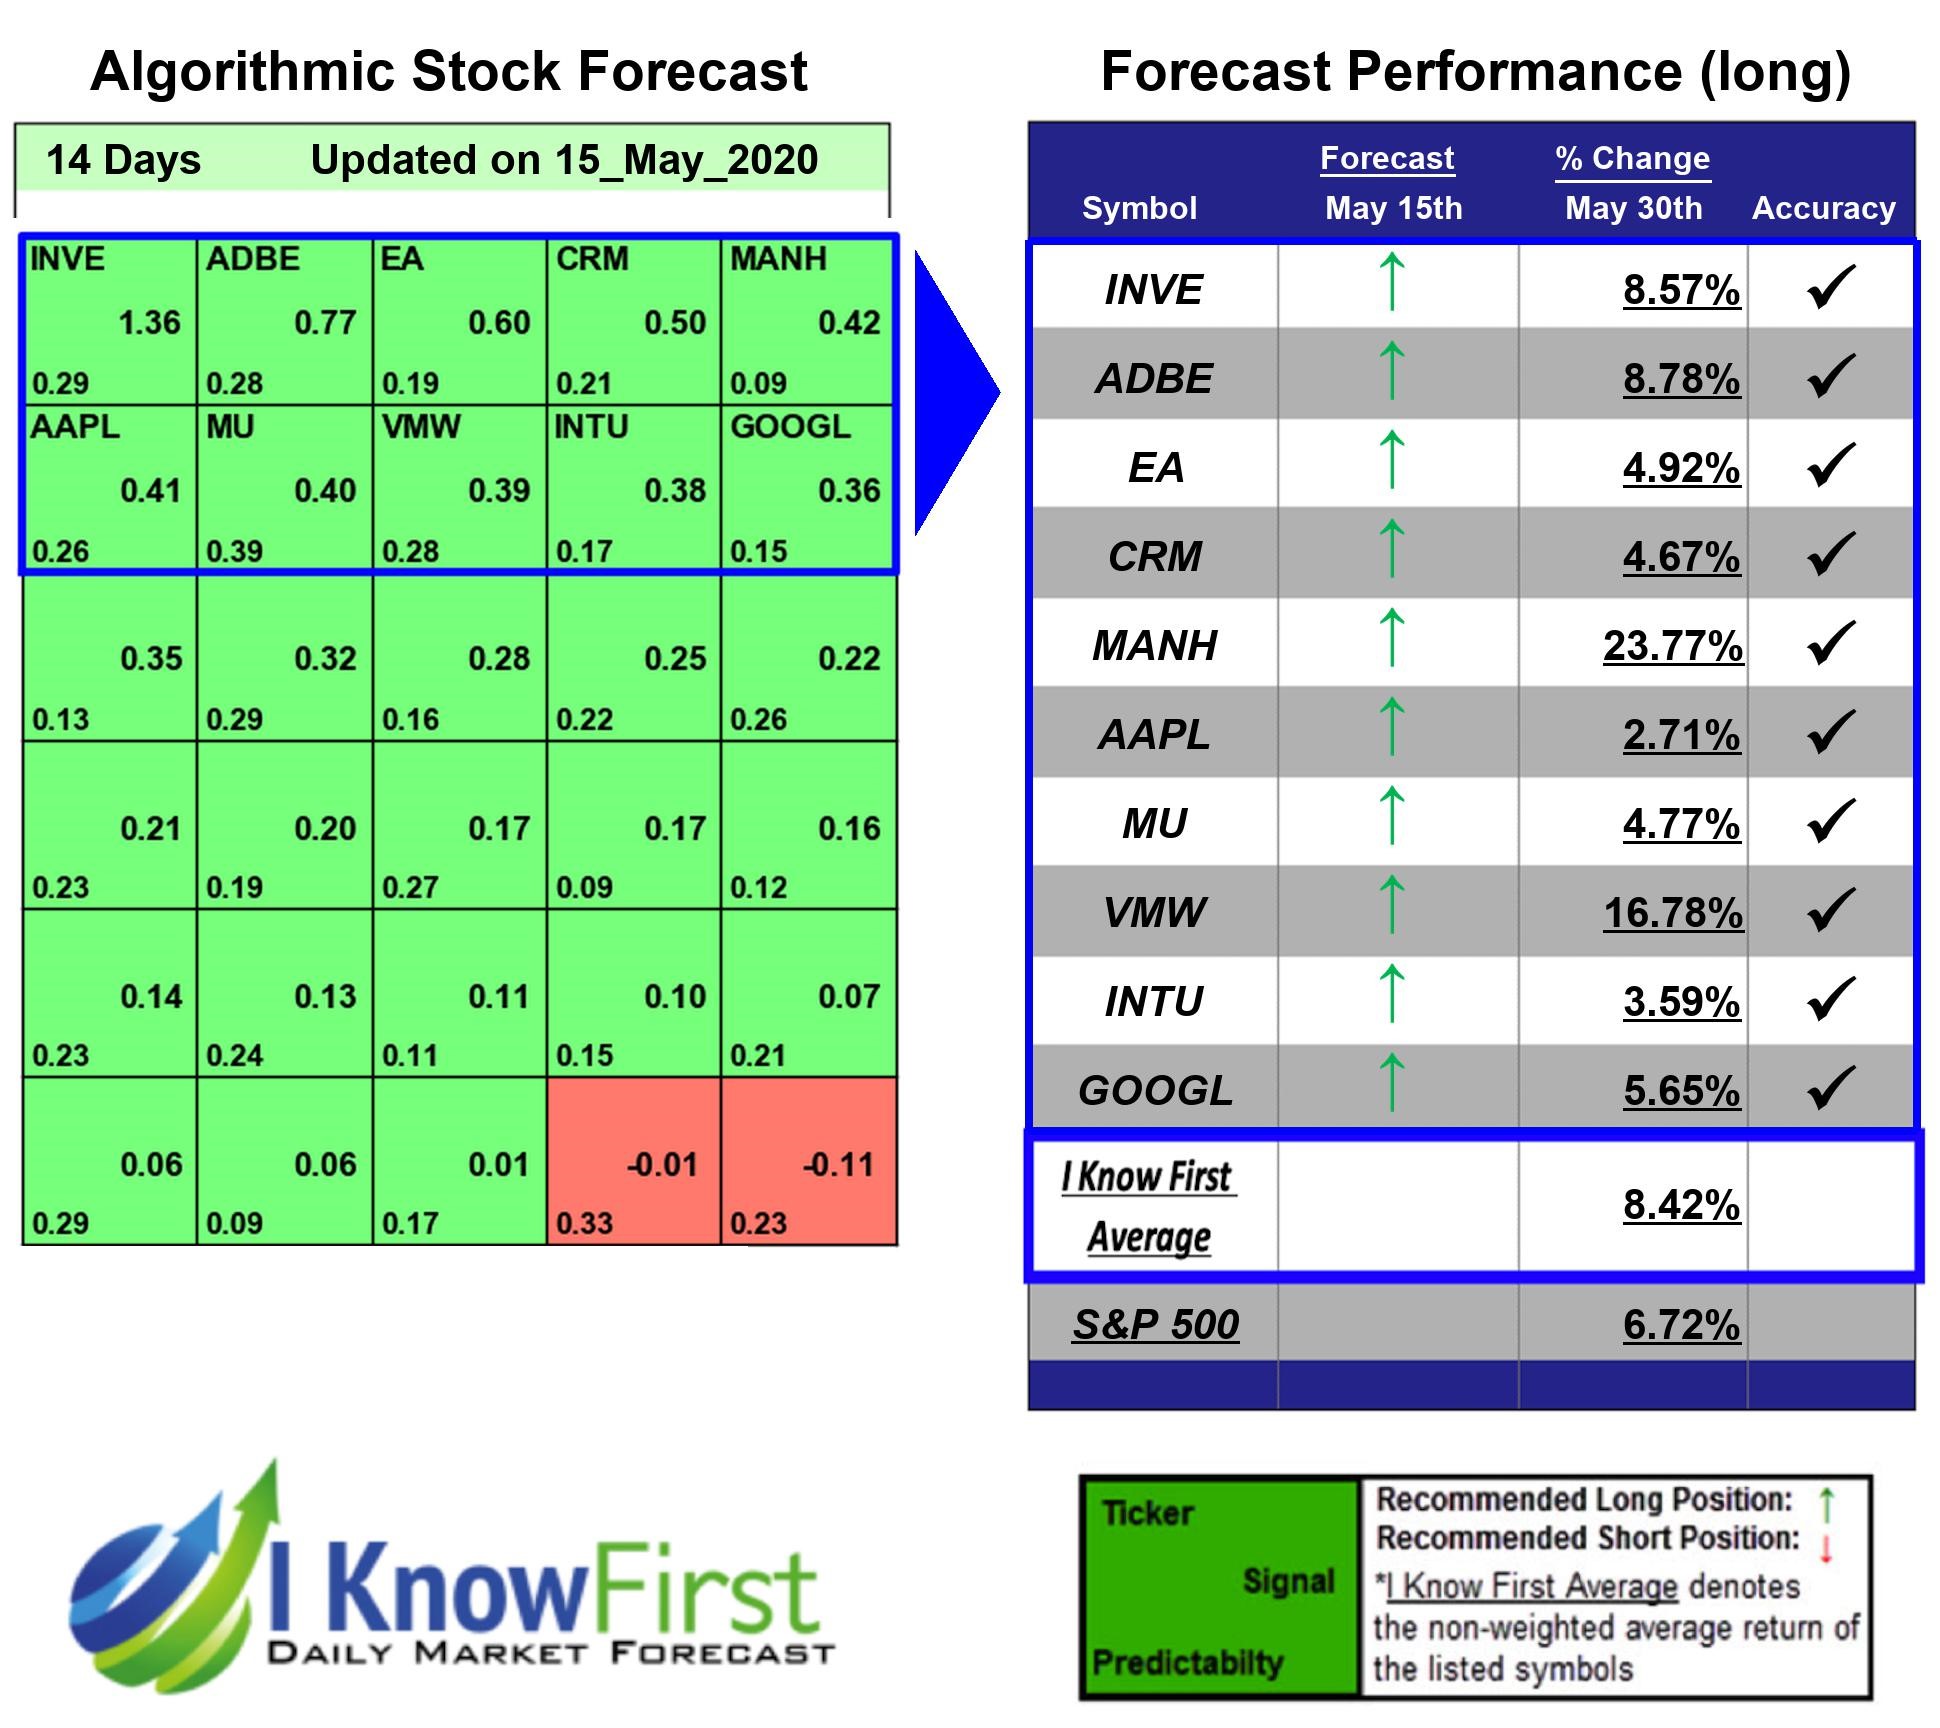

For this 14 Days forecast the algorithm had successfully predicted 10 out of 10 movements. The greatest return came from MANH at 23.77%. Further notable returns came from VMW and ADBE at 16.78% and 8.78%, respectively. This algorithmic forecast package presented an overall return of 8.42% versus S&P 500’s performance of 6.72% providing a market premium of 1.70%.
Manhattan Associates, Inc. (Manhattan), incorporated on February 24, 1998, is a developer and provider of supply chain commerce solutions. The Company operates through three geographical segments: the Americas, Europe, Middle East and Africa (EMEA), and the Asia Pacific (APAC). It is engaged in developing, selling, deploying, servicing and maintaining software solutions designed to manage supply chains, inventory and omni-channel operations for retailers, wholesalers, manufacturers, logistics providers and other organizations. The Company’s solutions consist of software, services and hardware, which coordinate people, workflows, assets, events and tasks across the functions linked in a supply chain from planning through execution. Its solutions enable coordinating the actions, data exchange and communication of participants in supply chain ecosystems, such as manufacturers, suppliers, distributors, trading partners, transportation providers, channels (such as catalogers, store retailers and Web outlets) and consumers.
Algorithmic traders utilize these daily forecasts by the I Know First market prediction system as a tool to enhance portfolio performance, verify their own analysis and act on market opportunities faster. This forecast was sent to current I Know First subscribers.
How to interpret this diagram
Algorithmic Stock Forecast: The table on the left is a stock forecast produced by I Know First’s algorithm. Each day, subscribers receive forecasts for six different time horizons. Note that the top 10 stocks in the 1-month forecast may be different than those in the 1-year forecast. In the included table, only the relevant stocks have been included. The boxes are arranged according to their respective signal and predictability values (see below for detailed definitions). A green box represents a positive forecast, suggesting a long position, while a red represents a negative forecast, suggesting a short position.
Please note-for trading decisions use the most recent forecast. Get today’s forecast and Top stock picks.


