
Predicting the S&P 500 Stock Universe
 This “Predicting the S&P 500 Stock Universe” article was written by Yuxiao Yang – Financial Analyst at I Know First.
Highlights:
- The S&P 500 index is often used as a market benchmark for equities, it’s made up of 500 of the largest companies traded on either the NYSE, Nasdaq, or Cboe.
- There is a huge disagreement between leading investment banks in the S&P 500 outlook for 2022.
- I Know First can help to identify the right investment direction.

Overview of the S&P500 Index
Standard & Poor’s grew out of two companies: Poor’s Publishing, a publisher of railroad industry guidebooks officially founded in 1868, and the Standard Statistics Bureau, founded in 1906, published financial data on companies. The two firms merged in 1941, to create Standard & Poor’s.
The S&P 500 index is often used as a market benchmark for equities, it’s made up of 500 of the largest companies traded on either the NYSE, Nasdaq, or Cboe and measures the performance of the large-cap segment of the market.
The S&P 500 is weighted by float-adjusted market capitalization, “Float-adjusted” means only counting the shares available to the public, excluding those held by management, governments, and other companies. Then the market capitalization is calculated by taking the equity’s price and multiplying it by the number of shares available in the market. And the S&P 500 committee operates within specific criteria. To be eligible for S&P 500 index inclusion, a company should be a U.S. company, meet requirements with a $14.6B minimum market capitalization, be highly liquid, have a public float of at least 10% of its shares outstanding, and its most recent quarter’s earnings and the sum of its trailing four consecutive quarters’ earnings must be positive.
The History of the S&P 500 Index
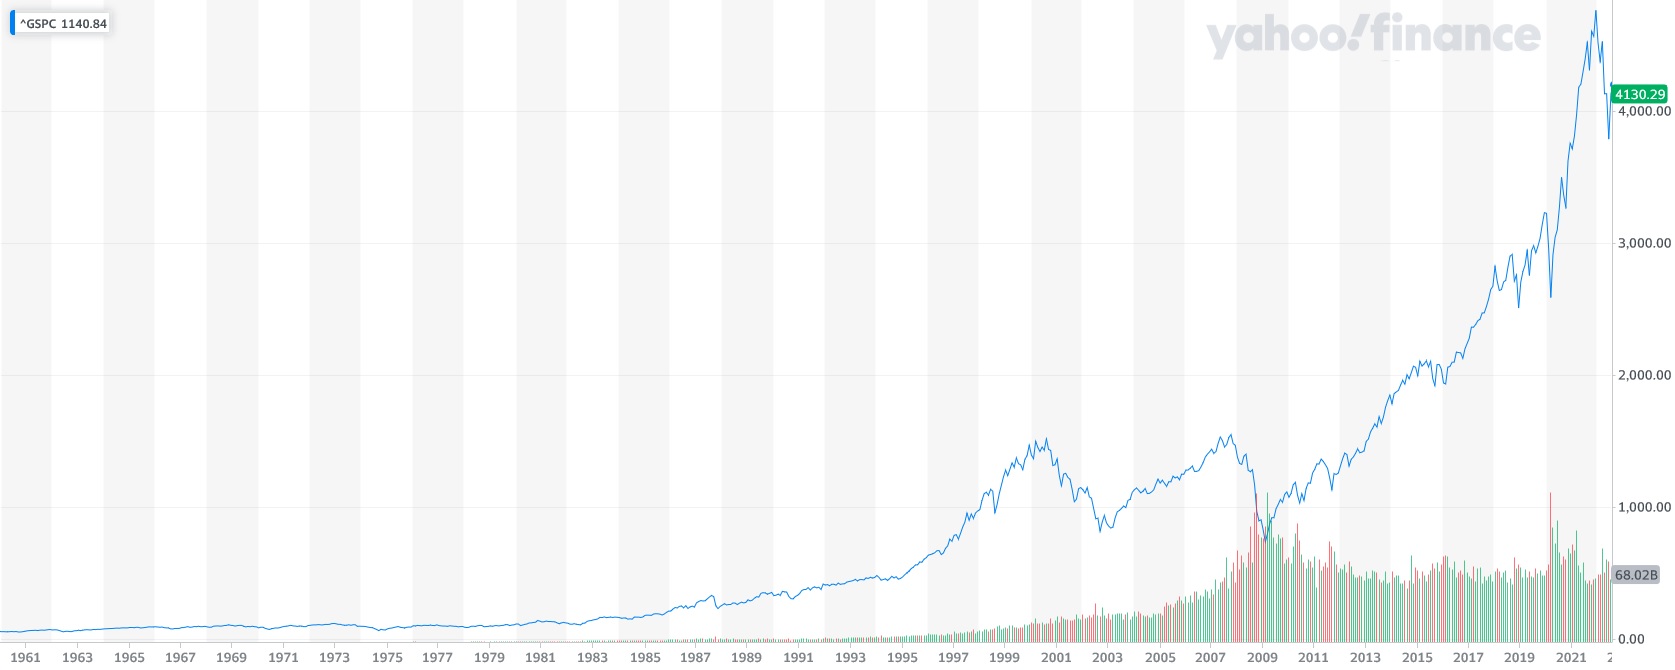
The S&P500 Index for the Period of January 1960 – July 2022
From 1969 to early 1981, the S&P500 index gradually declined. During this period, In the 1960s, low unemployment pushed up wages and consumer prices, and the U.S. economy was stuck in the doldrums. The S&P 500 Index entered the bull market from 1982 to 2000 as inflationary pressures have been successfully mitigated through Fed rate hikes and intervention.
In 2000, the stock market experienced a tech bubble. The period was characterized by inflated valuations, excessive public enthusiasm for stocks, and speculation in the technology sector. After that, the S&P 500 hit bottom in March 2009 during the global financial crisis. It was the biggest drop for the S&P since World War II. By March 2013, the S&P had recovered all its losses from the financial crisis, surpassing its 2007 high and the tech bubble high of 2000. The index has been on a bull run for nearly a decade. Steady economic growth and low-interest rates helped stock prices rise over the decade.
Then the global spread of COVID-19 hit the global economy and caused panic in the markets such that on March 23, 2020, the index plummeted to 2,237.40, a drop of 34% in just over a month. With the control of COVID-19 and the popularization of vaccines, the economy has recovered gradually in the post-pandemic era, S&P 500 Index return to the pre-pandemic level as well.
The Industry Outlook for the S&P500 in 2022
Some of Wall Street’s biggest firms are cutting their price targets for S&P 500, with Bank of America warning in a report that “there are many reasons to be concerned” after stocks fell about 20 percent.

Seven of the 11 sectors in the S&P 500 are facing lower earnings forecasts, according to FactSet. Evercore also cut its year-end S&P 500 target to 4,200 from 4,300, as analysts warned of corporate earnings are under pressure as expected recession coming. Mike Wilson, the chief strategist at Morgan Stanley, maintained his year-end target for the S&P 500 at just 3,900, while also predicting that the index could fall to 3,000 if a recession hits.
Even some of Wall Street’s most bullish strategists have adjusted S&P’s forecasts, including John Stoltzfus, Oppenheimer’s chief investment strategist, who cut his forecast to 4,800 from 5,330 amid ‘clear recession risks.’ However, stock market forecasts sometimes are so divergent. Just like Deutsche Bank and JPMorgan have totally different views on the forecast for Tesla, for the S&P 500 price forecast, the large divergence between the most bullish, J.P. Morgan at 4,900 and Bank of America all the way at 3,600.
Predicting the S&P500 Stock Universe with IKF
Currently, we are living in a period of high market uncertainty and it is where I Know First can help to find the right investment direction. I Know First provides a wide range of forecast packages for the S&P 500 stock universe based on our artificial intelligence algorithm to help our clients find the most promising investment opportunities: Top 5, Top 10, Top 20, Top 40, S&P 500 Stocks, and the S&P 500 Aggressive Stocks. Also, I Know First provides a forecast for the S&P 500 stock universe as a whole in the S&P 500 and SPY package that enables us to identify the future market direction (you can access our packages here). We provide forecasts for long positions and short positions with lengths of 3 days, 7 days, 14 days, 1 month, 3 months, and 1 year. Below you can see the investment result of our Top S&P 500 Stocks package which was recommended to our clients on July 17, 2022.
Package Name: Top S&P 500 Stocks
Recommended Positions: Long
Forecast Length: 1 Month (7/17/22 – 8/17/22)
I Know First Average: 24.35%
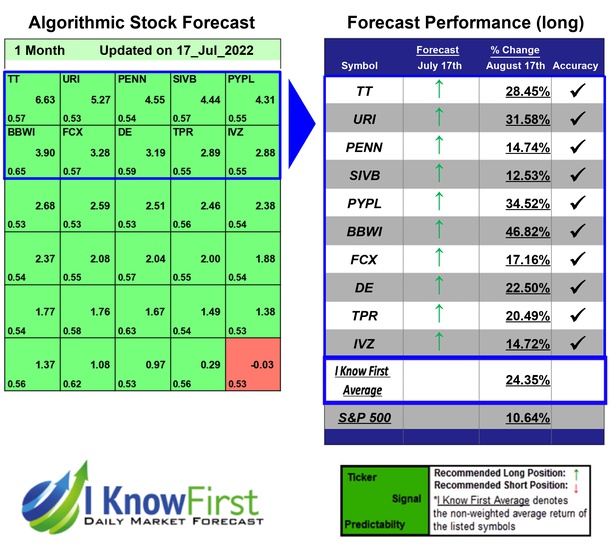

The algorithm correctly predicted 10 out of 10 of the suggested trades for this 1 Month forecast. BBWI was the top performing prediction with a return of 46.82%. PYPL and URI followed with returns of 34.52% and 31.58% for the 1 Month period. With these notable trade returns, the package itself registered an average return of 24.35% compared to the S&P 500’s return of 10.64% for the same period.
Also, you can see the investment result of our S&P 500 package which was recommended to our clients for the period from January 1st, 2020 to August 10th,2022.
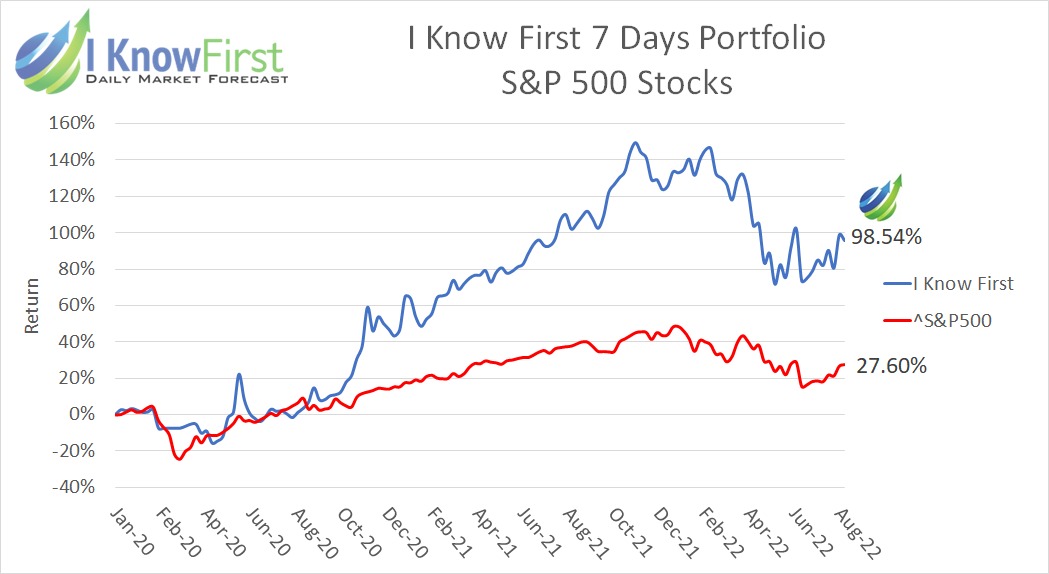
The investment strategy that was recommended by I Know First accumulated a return of 98.54%, which exceeded the S&P 500 return by 70.94%.

I Know First is one leading company that has been effectively using machine learning and AI-based algorithms to provide daily forecasts and facilitate trading for over 13,500 financial instruments. More importantly, I Know First’s algorithm can fulfill the idea of discovering “fractals” and patterns using a more accurate way through AI and machine learning without involving any human judgments. The algorithms can present historical price patterns based on the data inputs, testing the performance on years of market data, and validating them on the most recent data to prevent overfitting. If an input does not improve the model, it is “rejected”, and another input can be submitted. I Know First provides different forecast packages based on the AI algorithm which allows us to select the most promising stocks (you can access them here).
Conclusion
We are living in a period of high market uncertainty where leading investment banks provide a totally different outlook on the perspective of the stock market in 2022. The S&P 500 index is often used as a market benchmark for equities, it’s made up of 500 of the largest companies traded on either the NYSE, Nasdaq, or Cboe and measures the performance of the large-cap segment of the market. I Know First provides a wide range of forecast packages for the S&P500 stock universe based on our artificial intelligence algorithm to help our clients to identify the right investment direction for the market as a whole and find the most promising stocks in particular.

To subscribe today click here.
Please note-for trading decisions and use the most recent forecast.


