
MSCI Western Stocks Based on Predictive Analytics: Returns up to 449.39% in 1 Year
MSCI Western Stocks
This forecast is part of the MSCI Stocks Universe Package and it is designed for investors and analysts who need predictions stocks currently trading on Western stock markets, such as Germany, France and the USA. The MSCI Stocks Universe is based on the MSCI ACWI Index (part of the Modern Index Strategy) and captures all sources of equity returns in 23 developed and 24 emerging markets.
- Top 10 MSCI Western stocks for the long position
- Top 10 MSCI Western stocks for the short position
Package Name: MSCI Stocks Universe – Western Markets
Recommended Positions: Long
Forecast Length: 1 Year (3/10/20 – 3/10/21)
I Know First Average: 87.17%
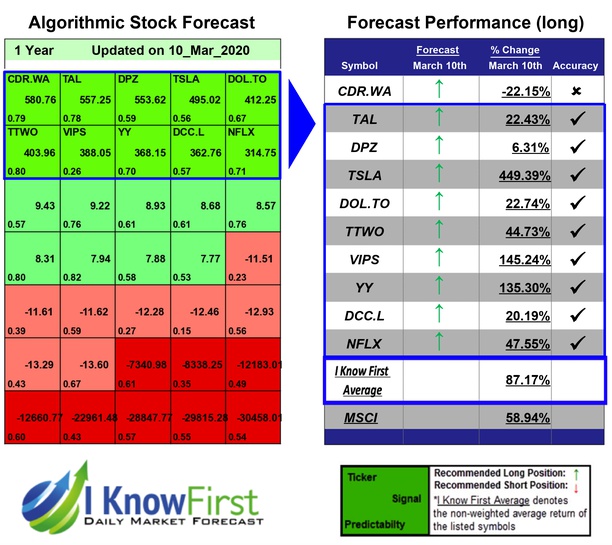
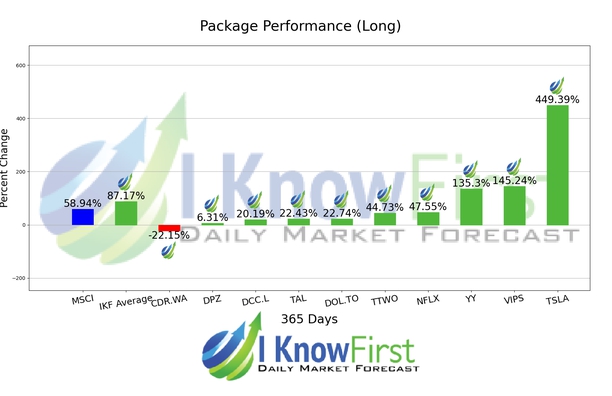
I Know First’s State of the Art Algorithm accurately forecasted 9 out of 10 trades in this MSCI Stocks Universe – Western Markets Package for the 1 Year time period. TSLA was the top-performing prediction with a return of 449.39%. Further notable returns came from VIPS and YY at 145.24% and 135.3%, respectively. The package had an overall average return of 87.17%, providing investors with a 28.23% premium over the MSCI return of 58.94% during the period.
Algorithmic traders utilize these daily forecasts by the I Know First market prediction system as a tool to enhance portfolio performance, verify their own analysis and act on market opportunities faster. This forecast was sent to current I Know First subscribers.
How to interpret this diagram
Algorithmic Stock Forecast: The table on the left is a stock forecast produced by I Know First’s algorithm. Each day, subscribers receive forecasts for six different time horizons. Note that the top 10 stocks in the 1-month forecast may be different than those in the 1-year forecast. In the included table, only the relevant stocks have been included. The boxes are arranged according to their respective signal and predictability values (see below for detailed definitions). A green box represents a positive forecast, suggesting a long position, while a red represents a negative forecast, suggesting a short position.
Please note-for trading decisions use the most recent forecast. Get today’s forecast and Top stock picks.


