Most Undervalued Stocks Based on Big Data: Returns up to 48.31% in 14 Days
Most Undervalued Stocks
This Retail Stocks forecast is designed for investors and analysts who need predictions for the best undervalued stocks to invest in the retail estate sector (see Retail Stocks Package). It includes 20 stocks with bullish and bearish signals:
- Top 10 Retail stocks for the long position
- Top 10 Retail stocks for the short position
Package Name: Retail Stocks
Recommended Positions: Long
Forecast Length: 14 Days (9/27/2020 – 10/12/2020)
I Know First Average: 13.68%
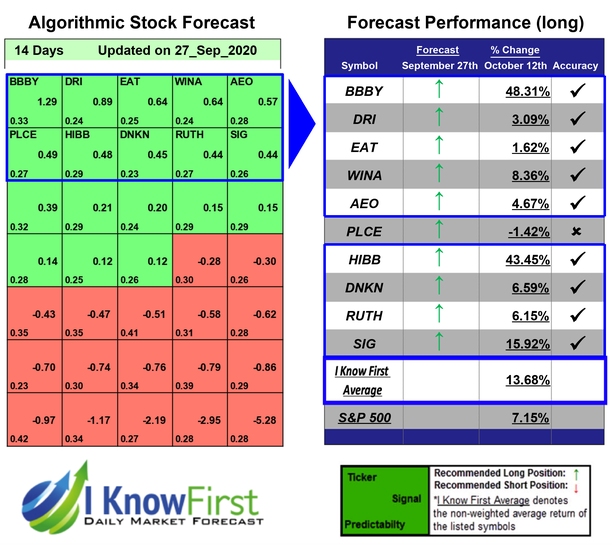
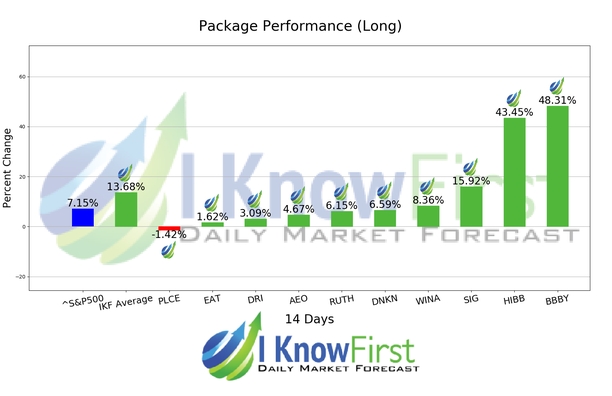
For this 14 Days forecast the algorithm had successfully predicted 9 out of 10 movements. The prediction with the highest return was BBBY, at 48.31%. HIBB, and SIG had notable returns of 43.45% and 15.92%. The package’s overall average return was 13.68%, providing investors with a 6.53% premium over the S&P 500’s return of 7.15% during the same period.
Bed Bath & Beyond Inc., incorporated on October 5, 1971, is a retailer, which operates under the names Bed Bath & Beyond (BBB), Christmas Tree Shops, Christmas Tree Shops andThat! or andThat! (collectively, CTS), Harmon or Harmon Face Values (collectively, Harmon), buybuy BABY (Baby) and World Market, Cost Plus World Market or Cost Plus (collectively, Cost Plus World Market). The Company operates in two segments: North American Retail and Institutional Sales.
Algorithmic traders utilize these daily forecasts by the I Know First market prediction system as a tool to enhance portfolio performance, verify their own analysis and act on market opportunities faster. This forecast was sent to current I Know First subscribers.
How to interpret this diagram
Algorithmic Stock Forecast: The table on the left is a stock forecast produced by I Know First’s algorithm. Each day, subscribers receive forecasts for six different time horizons. Note that the top 10 stocks in the 1-month forecast may be different than those in the 1-year forecast. In the included table, only the relevant stocks have been included. The boxes are arranged according to their respective signal and predictability values (see below for detailed definitions). A green box represents a positive forecast, suggesting a long position, while a red represents a negative forecast, suggesting a short position.
Please note-for trading decisions use the most recent forecast. Get today’s forecast and Top stock picks.