
Momentum Stocks Based on Genetic Algorithms: Returns up to 11.83% in 3 Days
Momentum Stocks
The Momentum Stocks Package is designed for investors and analysts who need predictions for stocks currently at their 52-week high price level. It includes 20 stocks with bullish and bearish signals and indicates the best shares to buy and sell:
- 52 Weeks High Top 10 stocks for the long position
- 52 Weeks High Top 10 stocks for the short position
![]()
![]()
Package Name: 52 Week High Stocks
Recommended Positions: Long
Forecast Length: 3 Days (9/23/21 – 9/26/21)
I Know First Average: 2.65%

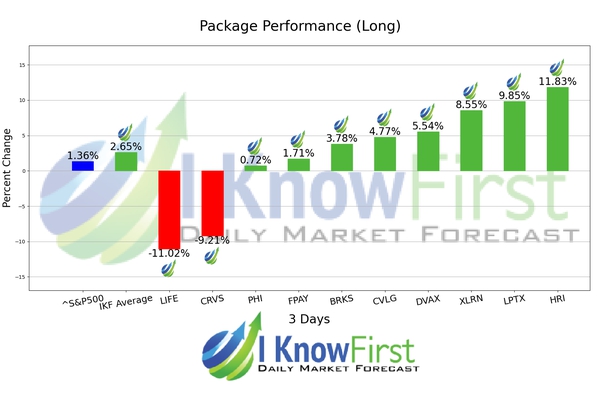
This 52 Week High Stocks Package forecast had correctly predicted 8 out of 10 stock movements. HRI was the highest-earning trade with a return of 11.83% in 3 Days. LPTX and XLRN also performed well for this time horizon with returns of 9.85% and 8.55%, respectively. The 52 Week High Stocks package had an overall average return of 2.65%, providing investors with a premium of 1.29% over the S&P 500’s return of 1.36%.
Herc Holdings Inc. (HRI) operates as an equipment rental supplier in North America. It rents equipment, such as aerial, air compressors and tools, climate control, compaction and paving, concrete and masonry, earthmoving, floor care and surface preparation, material handling, power generation, procontractors, pumps, and trucks and trailers. The company also sells used equipment through online and provides financing and warranty services on the equipment. As of July 01, 2016, it operated approximately 280 company-operated branches. In addition, the company provides ProSolutions, an industry specific solutions-based service. It serves commercial and residential construction, industrial and manufacturing, refineries and petrochemicals, civil infrastructure, automotive, government and municipalities, energy, remediation, emergency response, facilities, entertainment, and agriculture markets. Herc Holdings Inc. (HRI) is based in Bonita Springs, Florida.
Algorithmic traders utilize these daily forecasts by the I Know First market prediction system as a tool to enhance portfolio performance, verify their own analysis and act on market opportunities faster. This forecast was sent to current I Know First subscribers.
How to interpret this diagram
Algorithmic Stock Forecast: The table on the left is a stock forecast produced by I Know First’s algorithm. Each day, subscribers receive forecasts for six different time horizons. Note that the top 10 stocks in the 1-month forecast may be different than those in the 1-year forecast. In the included table, only the relevant stocks have been included. The boxes are arranged according to their respective signal and predictability values (see below for detailed definitions). A green box represents a positive forecast, suggesting a long position, while a red represents a negative forecast, suggesting a short position.
Please note-for trading decisions use the most recent forecast. Get today’s forecast and Top stock picks.


