
Momentum Stocks Based on Data Mining: Returns up to 172.66% in 3 Months
Momentum Stocks
The 52 Week High Stocks Package is designed for investors and analysts who need predictions for stocks currently at their 52-week high price level. It includes 20 momentum stocks with bullish and bearish signals and indicates the best shares to buy and sell:
- 52 Weeks High Top 10 stocks for the long position
- 52 Weeks High Top 10 stocks for the short position
![]()
![]()
Package Name: 52 Week High Stocks
Recommended Positions: Long
Forecast Length: 3 Months (3/10/21 – 6/10/21)
I Know First Average: 32.45%
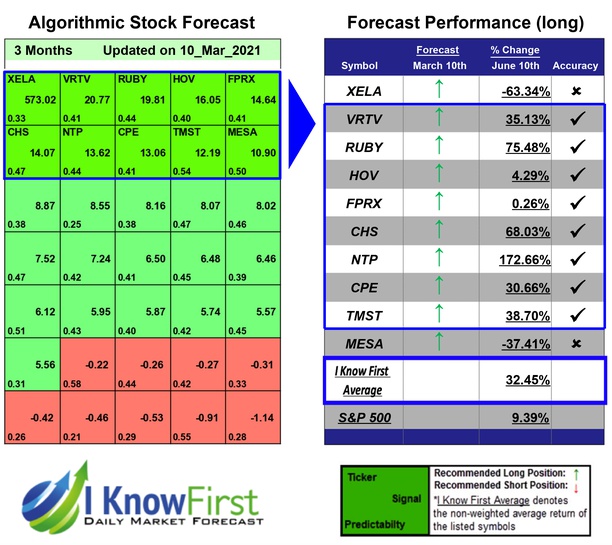

The algorithm correctly predicted 8 out 10 of the suggested trades in the 52 Week High Stocks Package for this 3 Months forecast. The prediction with the highest return was NTP, at 172.66%. Further notable returns came from RUBY and CHS at 75.48% and 68.03%, respectively. The overall average return in this 52 Week High Stocks package was 32.45%, providing investors with a 23.06% premium over the S&P 500’s return of 9.39% during the same period.
Nam Tai Property Inc. (NTP) engages in the property development and management activities in the People’s Republic of China. It focuses on developing two parcels of land for converting into commercial complexes in Gushu and Guangming, Shenzhen. The company was formerly known as Nam Tai Electronics, Inc. and changed its name to Nam Tai Property Inc. (NTP) in April 2014. Nam Tai Property Inc. (NTP) was founded in 1975 and is headquartered in Shenzhen, the People’s Republic of China.
Algorithmic traders utilize these daily forecasts by the I Know First market prediction system as a tool to enhance portfolio performance, verify their own analysis and act on market opportunities faster. This forecast was sent to current I Know First subscribers.
How to interpret this diagram
Algorithmic Stock Forecast: The table on the left is a stock forecast produced by I Know First’s algorithm. Each day, subscribers receive forecasts for six different time horizons. Note that the top 10 stocks in the 1-month forecast may be different than those in the 1-year forecast. In the included table, only the relevant stocks have been included. The boxes are arranged according to their respective signal and predictability values (see below for detailed definitions). A green box represents a positive forecast, suggesting a long position, while a red represents a negative forecast, suggesting a short position.
Please note-for trading decisions use the most recent forecast. Get today’s forecast and Top stock picks.


