
Modeling Volatility with TGARCH
 This “Modeling Volatility with TGARCH” article was written by Sergey Okun – Senior Financial Analyst at I Know First, Ph.D. in Economics.
Highlights
- Volatility has a number of statistical properties that must be taken into account in the modeling process.
- The TGARCH model is one of the GARCH family models which allows for modeling volatility.
- I Know First provides volatility predictions for short-term and long-term periods based on the machine learning approach.
Volatility Properties
Volatility is the most popular measure of investment risk. In one of our previous articles, we analyzed the correlation between the S&P500 returns and ETP VIXY and ETP VIXP, which track an index with exposure to futures contracts on the CBOE Volatility index, where we noticed that there are negative unconditional and conditional correlations between the S&P500 returns and volatility dynamic. This fact actualizes modeling volatility dynamics for prediction reasons.
However, what do we know about volatility? A special feature of stock volatility is that it is not directly observable. One of the most relevant empirical features of financial returns time series is volatility clustering. The term volatility clustering denotes the fact that large returns (in absolute value) tend to be followed by large returns (in absolute value), and vice versa, as shown in Figure 2. While the S&P 500 returns appear to have weak or no serial dependence in Figure 1, the S&P500 absolute returns appear to have strong serial dependence in Figure 2. In this article, we researched the question of volatility scaling in the case of the autocorrelation process in stock returns.

(Figure 1: The S&P500 Daily Returns for the Period of January 3rd, 2000 – September 2nd, 2022)

(Figure 2: The S&P500 Absolute Daily Returns for the Period of January 3rd, 2000 – September 2nd, 2022)
When we analyze volatility, we need to take into account the leverage effect. The leverage effect underlines that positive and negative returns can have different effects on volatility. Actually, it implies that a negative return increases volatility more than a positive one of the same size. At the level of a company, a negative return on a stock decreases the equity value of the firm. If the debt is constant this implies that the leverage ratio of the firm is increasing, thus making the firm riskier. Thus, the leverage effect implies that the volatility dynamic is asymmetric in the sense that volatility reacts differently to positive and negative shocks.
Volatility evolves over time in a continuous manner, which means that volatility jumps are rare. Also, volatility does not diverge to infinity, which means that volatility varies within some fixed range. Statistically speaking, this means that volatility is often stationary.
Applying TGARCH Model
The TGARCH model is one of the GARCH family models which allows to model volatility with taking into account the leverage effect.
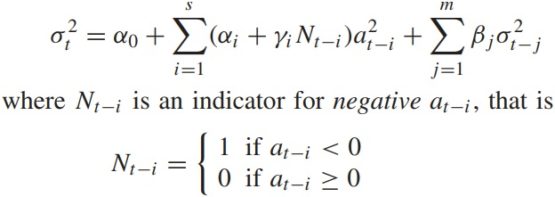
(Figure 3: TGARCH Model)
To find the parameters from Figure 3, we need to maximize the log-likelihood function in Figure 4.

So, let us model the volatility of the S&P 500 using the TGARCH model with lag 1. Our calculations are based on S&P500 daily returns from September 6th, 2017 to September 2nd, 2022. Table 1 presents estimated parameters for the TGARCH model by maximizing the log-likelihood function in Figure 4.
| Constant | 0.0728% |
| Unconditional variance (α0) | 0.0000034 |
| ARCH (αi) | 0.1094 |
| Negative TGARCH (γi) | 0.2455 |
| GARCH ( βj) | 0.7637 |
| αi+βj | 0.8731 |
| Long-run volatility | 0.5214% |
| Log Likelihood | 4 091.43 |
Figure 5 presents the volatility fitting of the S&P500 by the TGARCH model.

Forecasting Volatility with I Know First
The family of GARCH models enables us to model volatility based on statistical properties. Another approach is to use the machine learning approach. I Know First provides predictions for volatility based on the AI algorithm for six horizons: 3-day, 7-day, 14-day, 1-month, 3-months, and 1-year. I Know First has constructed the volatility package which contains such volatility indices as VIX, VXN, VXD, VXO, and more, also the VIX index is included in the World Indices package (you can access our forecast packages here). Below, we can observe the performance of the VIX index prediction which was sent to our clients as part of the Indices Forecast package. In the Figures below, we can notice that the VIX index went in line with the I Know First forecast.
Package Name: Indices Forecast
Recommended Positions: Long
Forecast Length: 7 Days (8/24/22 – 8/31/22)
I Know First Average: 3.59%


Conclusion
Volatility is the most popular measure of investment risk. However, a special feature of stock volatility is that it is not directly observable. The TGARCH model is one of the GARCH family models which allows us to model volatility based on statistical properties. At the same time, I Know First provides volatility predictions for short-term and long-term periods based on the machine learning approach.

To subscribe today click here.
Please note-for trading decisions use the most recent forecast.


