
Megacap Stocks Based on Stock Prediction Algorithm: Returns up to 27.0% in 1 Year
Megacap Stocks
This stock market forecast includes the best megacap stocks determined by the algorithm with a market capitalization of more than $100 billion.
- Top 10 Mega Cap stocks for the long position
- Top 10 Mega Cap stocks for the short position
Package Name: Mega Cap Forecast
Recommended Positions: Long
Forecast Length: 1 Year (9/18/2018 – 9/18/2019)
I Know First Average: 4.19%
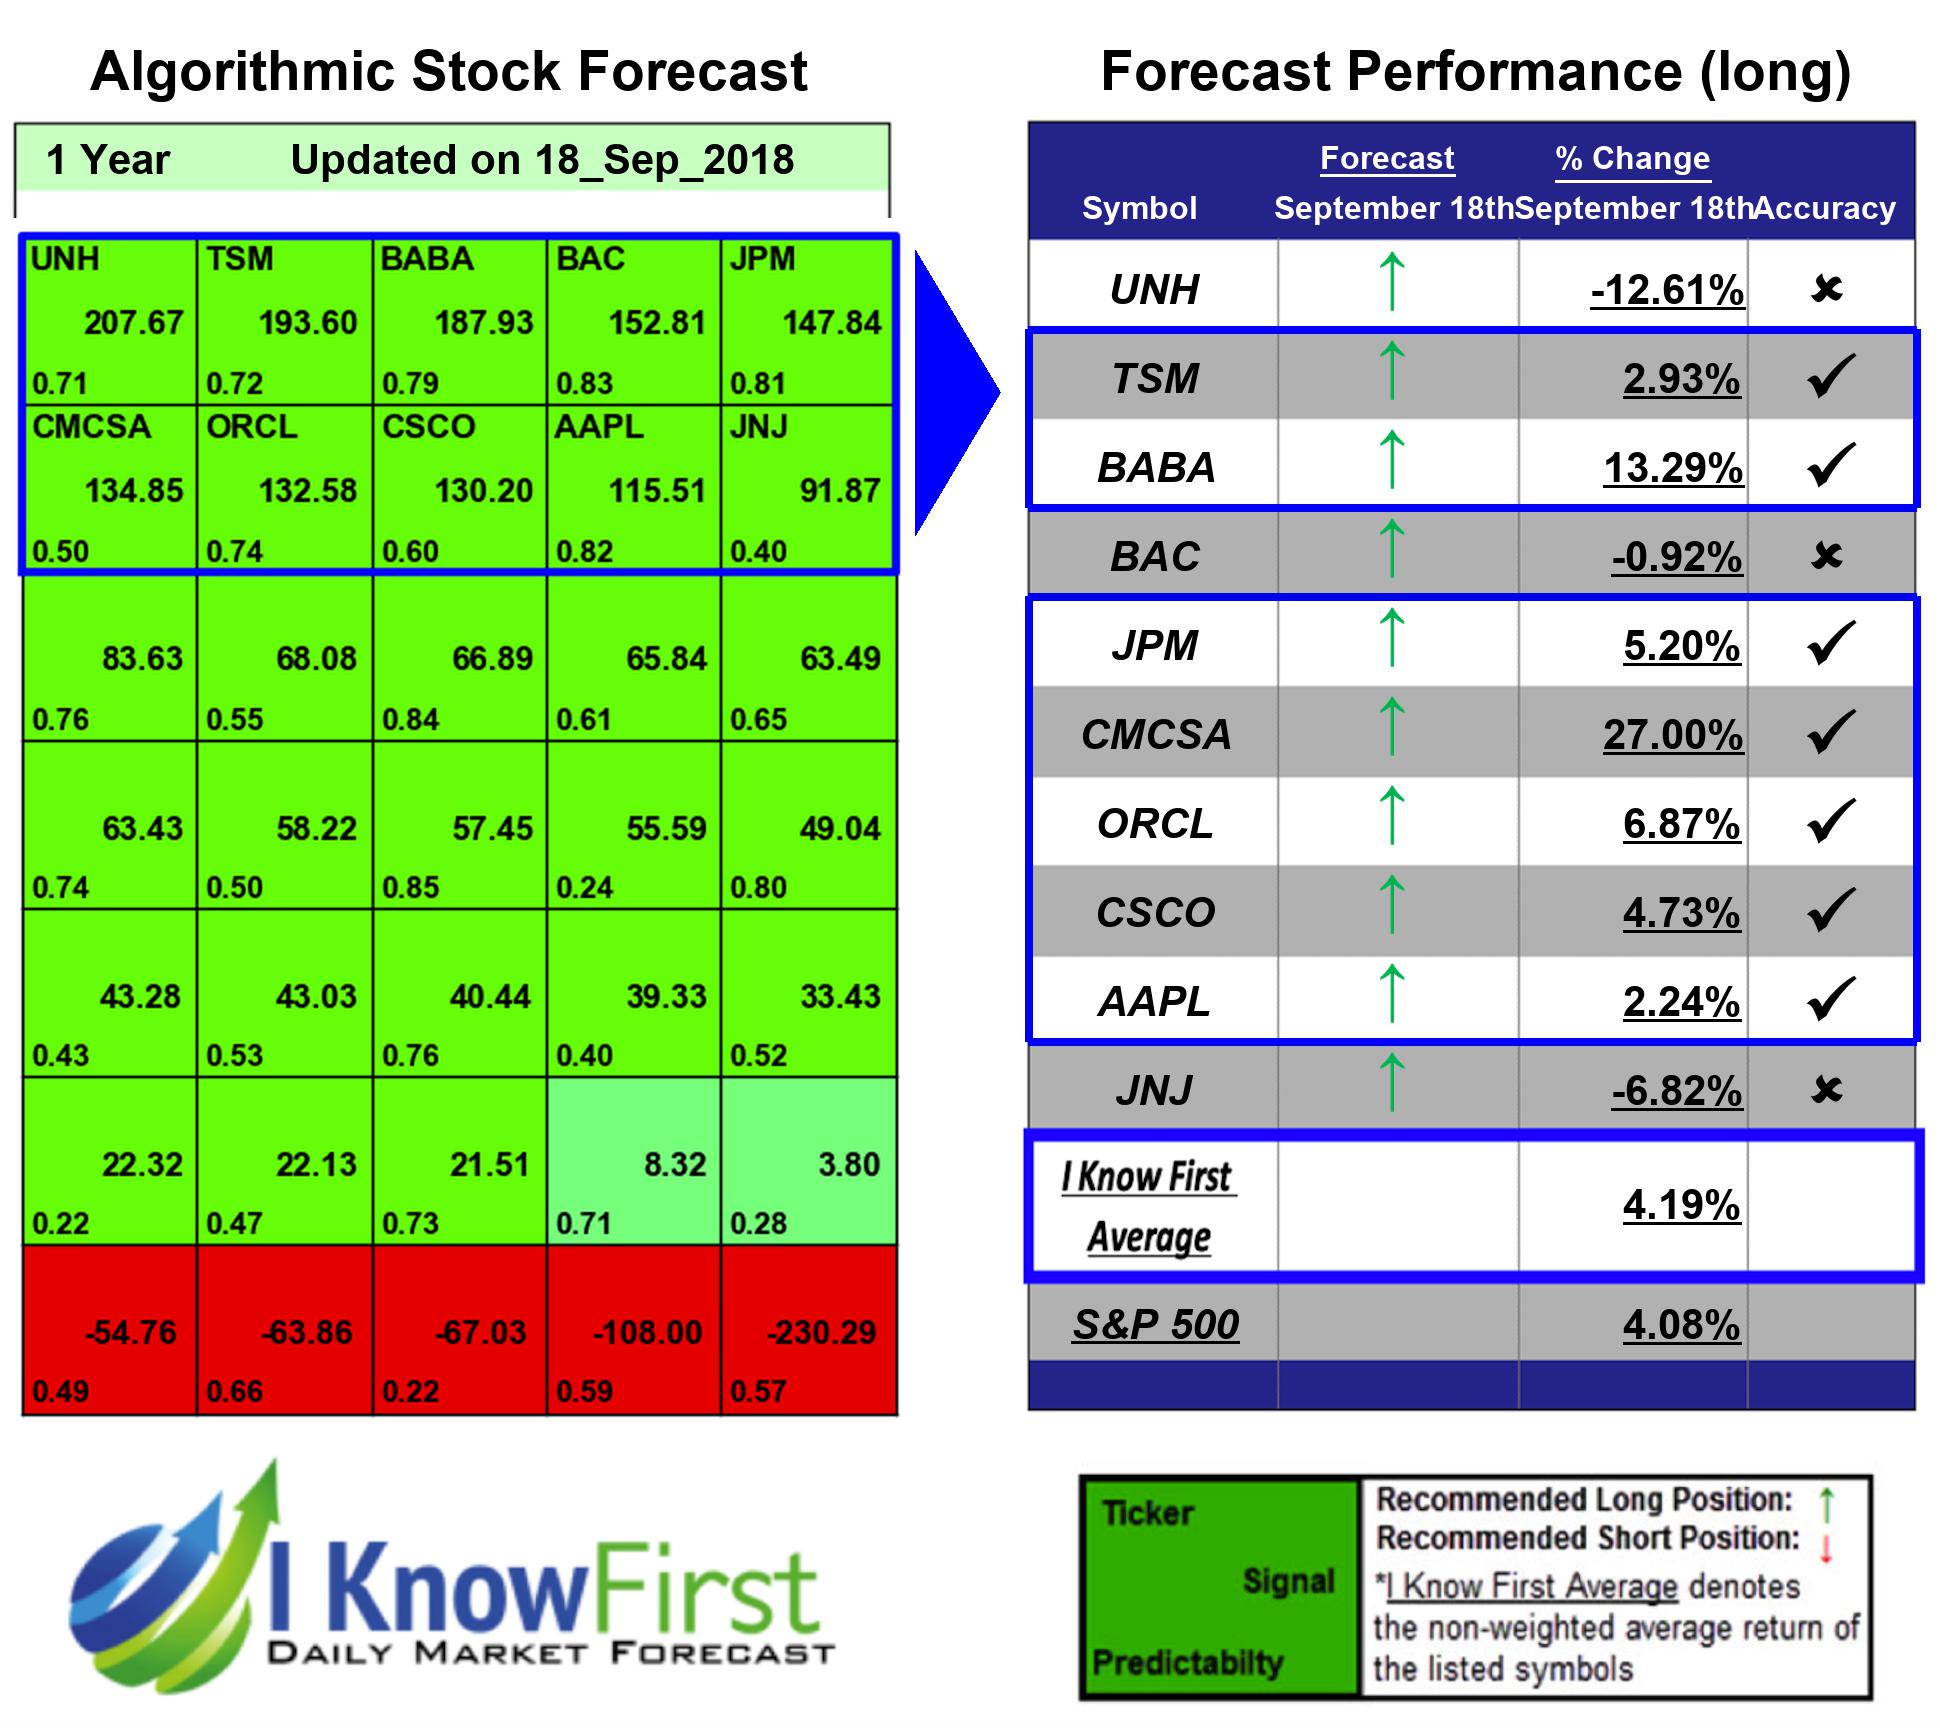

I Know First’s State of the Art Algorithm accurately forecasted 7 out of 10 trades in this Mega Cap Forecast Package for the 1 Year time period. The prediction with the highest return was CMCSA, at 27.0%. Additional high returns came from BABA and ORCL, at 13.29% and 6.87% respectively. With these notable trade returns, the package itself registered an average return of 4.19% compared to the S&P 500’s return of 4.08% for the same period.
Comcast Corporation, incorporated on December 7, 2001, is a media and technology company. The Company has two primary businesses: Comcast Cable and NBCUniversal. The Company’s Comcast Cable business operates in the Cable Communications segment. Its NBCUniversal business operates in four business segments: Cable Networks, Broadcast Television, Filmed Entertainment and Theme Parks (collectively, the NBCUniversal segments). Its other business interests consist primarily of Comcast Spectacor, which owns the Philadelphia Flyers and the Wells Fargo Center arena in Philadelphia, Pennsylvania and operates arena management-related businesses.
Algorithmic traders utilize these daily forecasts by the I Know First market prediction system as a tool to enhance portfolio performance, verify their own analysis and act on market opportunities faster. This forecast was sent to current I Know First subscribers.
How to interpret this diagram
Algorithmic Stock Forecast: The table on the left is a stock forecast produced by I Know First’s algorithm. Each day, subscribers receive forecasts for six different time horizons. Note that the top 10 stocks in the 1-month forecast may be different than those in the 1-year forecast. In the included table, only the relevant stocks have been included. The boxes are arranged according to their respective signal and predictability values (see below for detailed definitions). A green box represents a positive forecast, suggesting a long position, while a red represents a negative forecast, suggesting a short position.
Please note-for trading decisions use the most recent forecast. Get today’s forecast and Top stock picks.


