
Megacap Stocks Based on AI: Returns up to 22.43% in 7 Days
Megacap Stocks
This stock market forecast includes the best megacap stocks determined by the algorithm with a market capitalization of more than $100 billion.
- Top 10 Mega Cap stocks for the long position
- Top 10 Mega Cap stocks for the short position
Package Name: Mega Cap Forecast
Recommended Positions: Long
Forecast Length: 7 Days (5/27/2020 – 6/3/2020)
I Know First Average: 6.66%

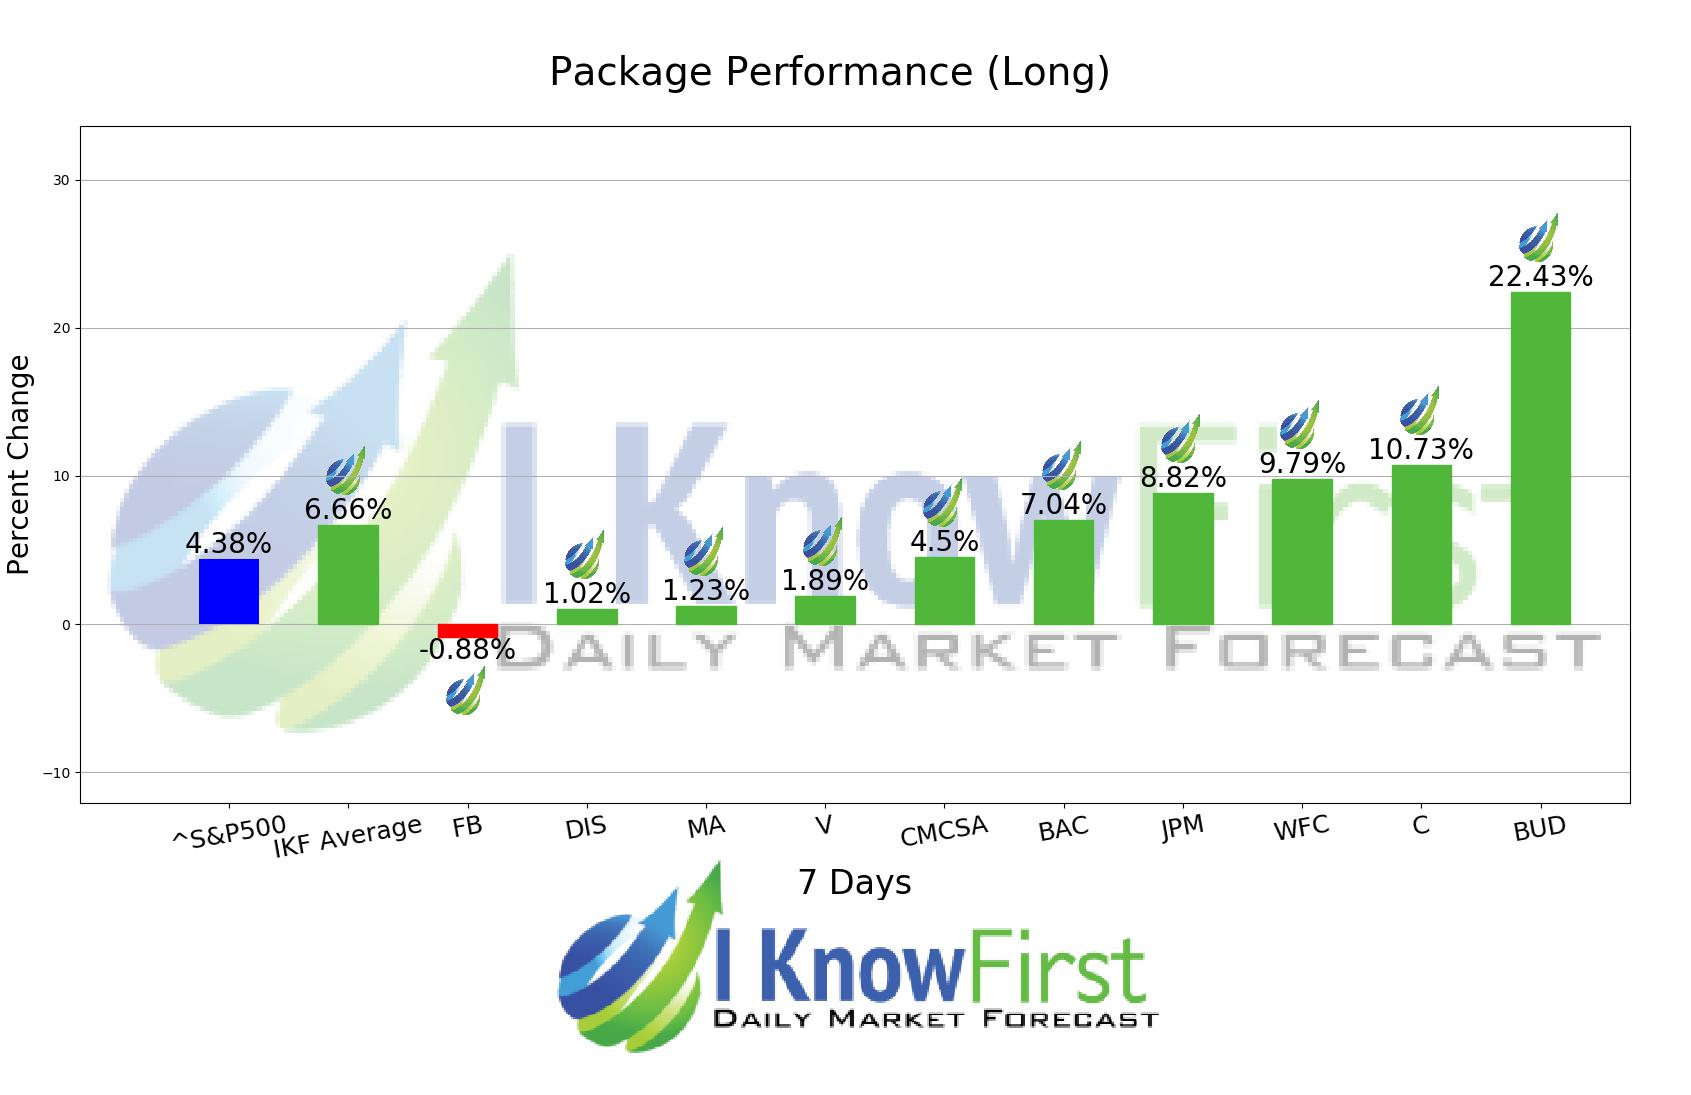
9 out of 10 stock prices in this forecast for the Mega Cap Forecast Package moved as predicted by the algorithm. The top-performing prediction in this forecast was BUD, which registered a return of 22.43%. Further notable returns came from C and WFC at 10.73% and 9.79%, respectively. The Mega Cap Forecast package had an overall average return of 6.66%, providing investors with a premium of 2.28% over the S&P 500’s return of 4.38%.
Anheuser-Busch InBev SA/NV, a brewing company, engages in the production, distribution, and sale of beer, alcoholic beverages, and soft drinks worldwide. It offers a portfolio of approximately 200 beer brands, including Budweiser, Corona, Stella Artois, Beck’s, Leffe, Hoegaarden, Bud Light, Skol, Brahma, Antarctica, Quilmes, Victoria, Modelo Especial, Michelob Ultra, Harbin, Sedrin, Klinskoye, Sibirskaya Korona, Chernigivske, Cass, and Jupiler. The company was founded in 1366 and is headquartered in Leuven, Belgium.
Algorithmic traders utilize these daily forecasts by the I Know First market prediction system as a tool to enhance portfolio performance, verify their own analysis and act on market opportunities faster. This forecast was sent to current I Know First subscribers.
How to interpret this diagram
Algorithmic Stock Forecast: The table on the left is a stock forecast produced by I Know First’s algorithm. Each day, subscribers receive forecasts for six different time horizons. Note that the top 10 stocks in the 1-month forecast may be different than those in the 1-year forecast. In the included table, only the relevant stocks have been included. The boxes are arranged according to their respective signal and predictability values (see below for detailed definitions). A green box represents a positive forecast, suggesting a long position, while a red represents a negative forecast, suggesting a short position.
Please note-for trading decisions use the most recent forecast. Get today’s forecast and Top stock picks.


