
Mega Cap Stocks Based on Pattern Recognition: Returns up to 32.54% in 3 Months
Mega Cap Stocks
This stock market forecast includes the best mega cap stocks determined by the algorithm with a market capitalization of more than $100 billion.
- Top 10 Mega Cap stocks for the long position
- Top 10 Mega Cap stocks for the short position
Package Name: Mega Cap Forecast
Recommended Positions: Long
Forecast Length: 3 Months (9/12/2019 – 12/12/2019)
I Know First Average: 12.73%
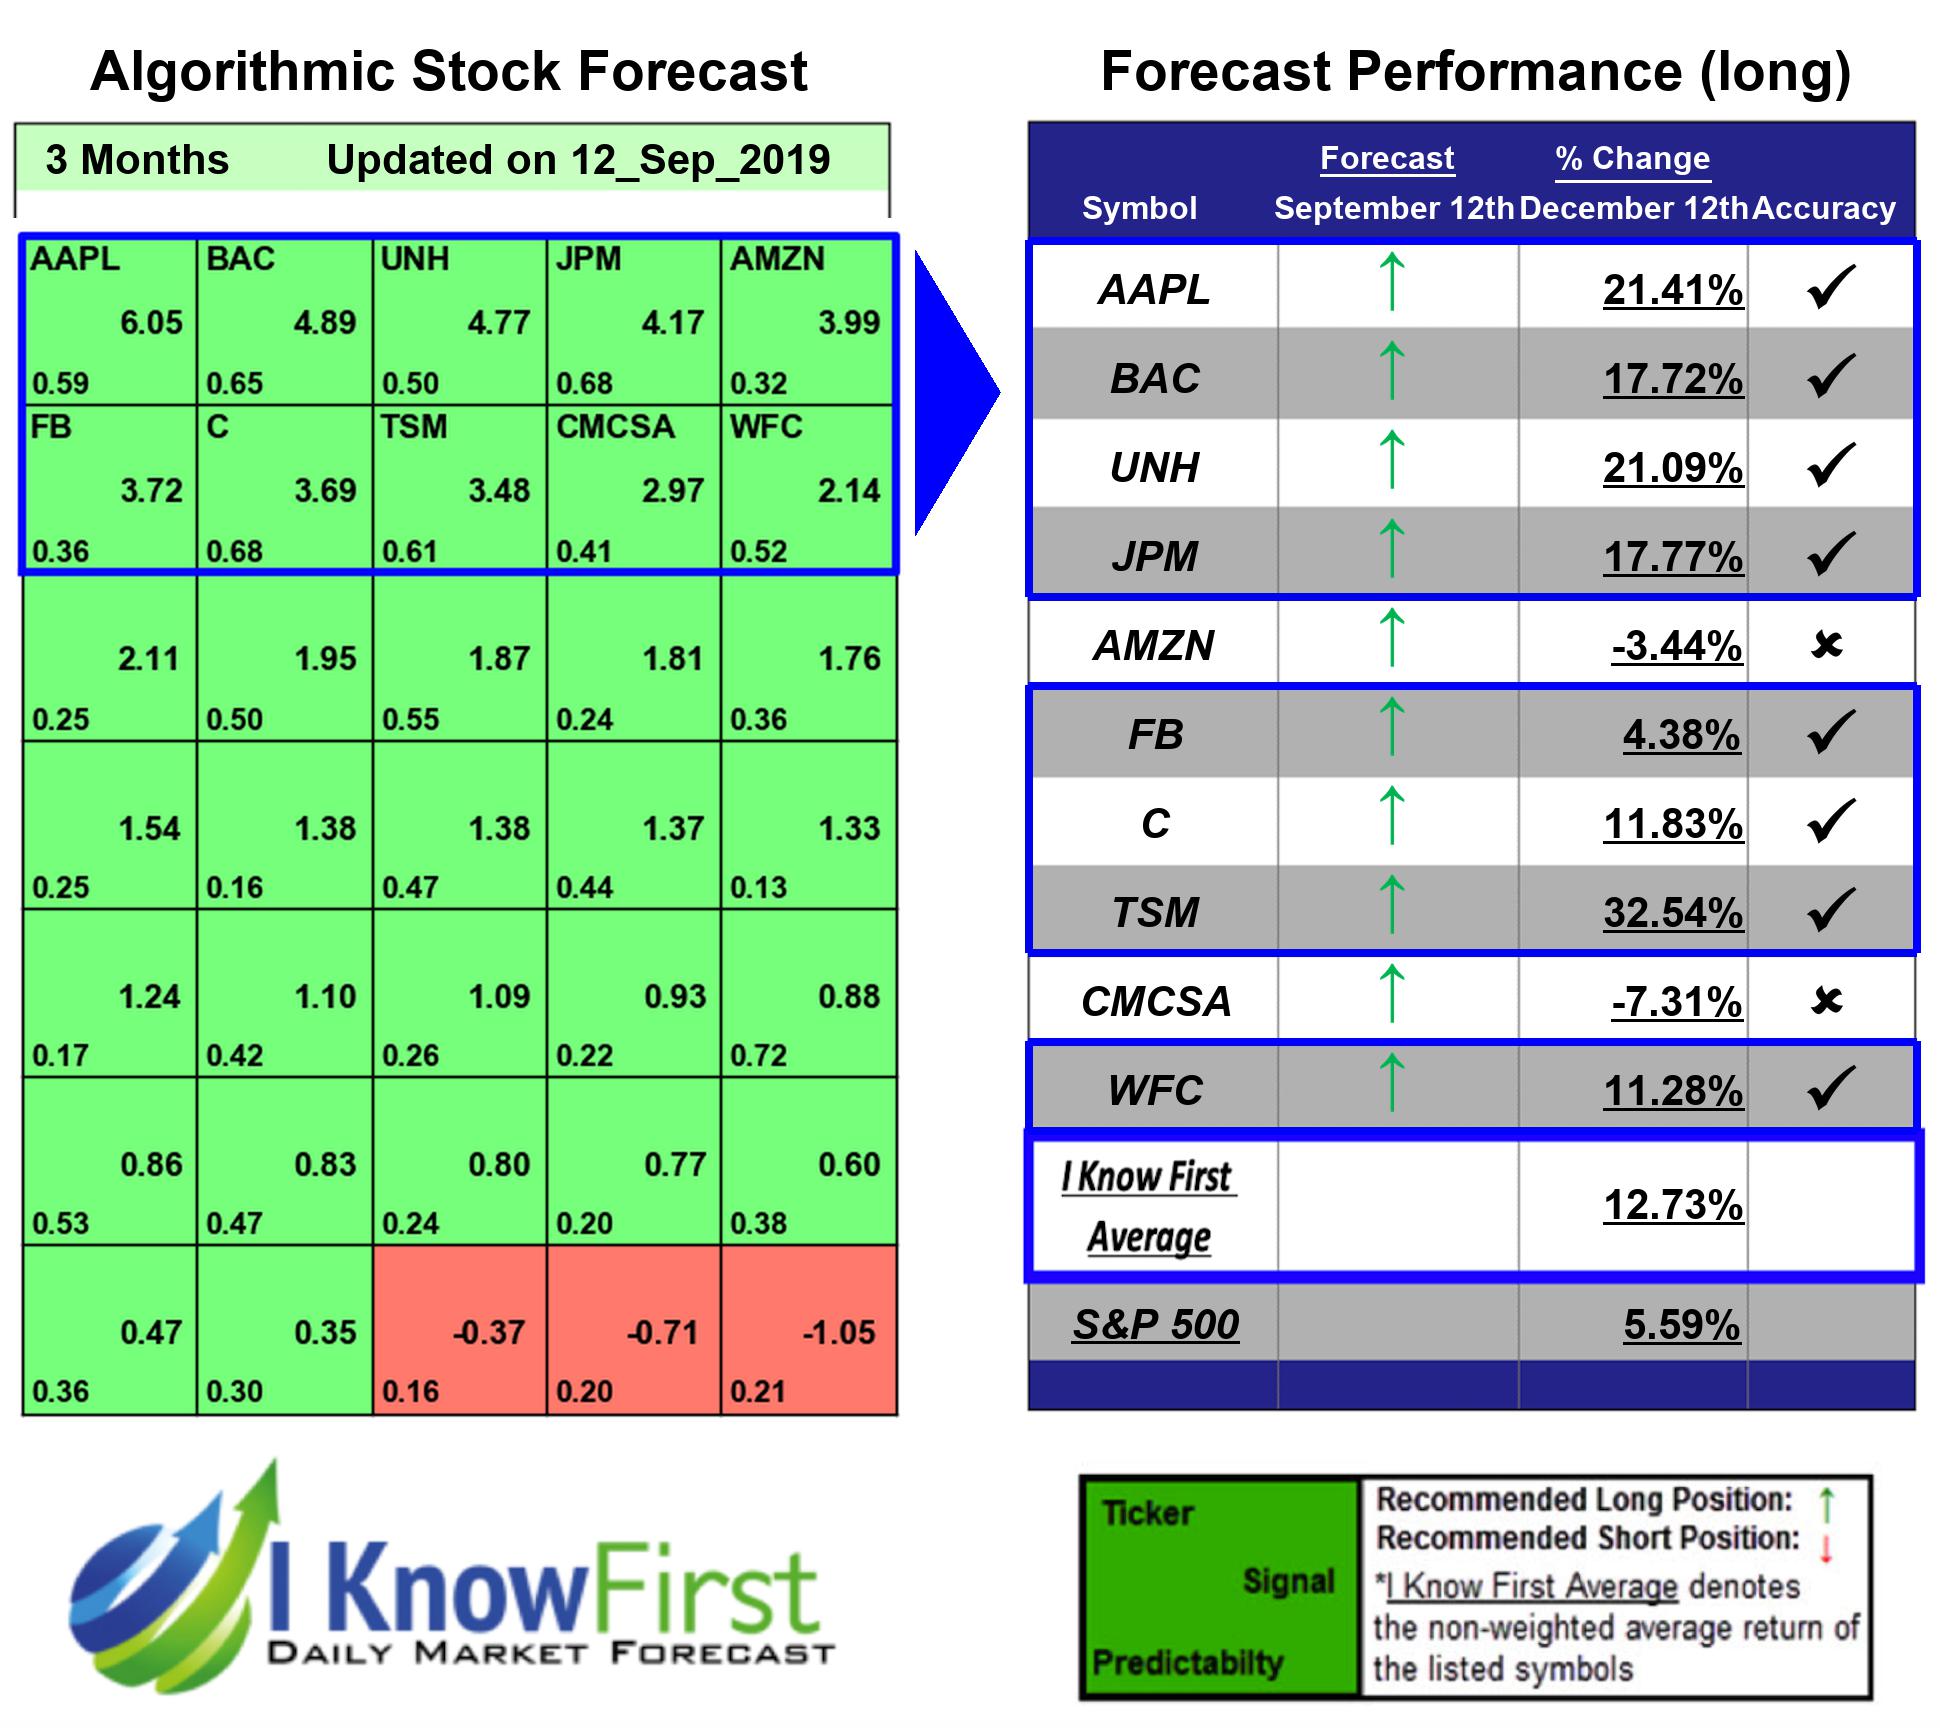
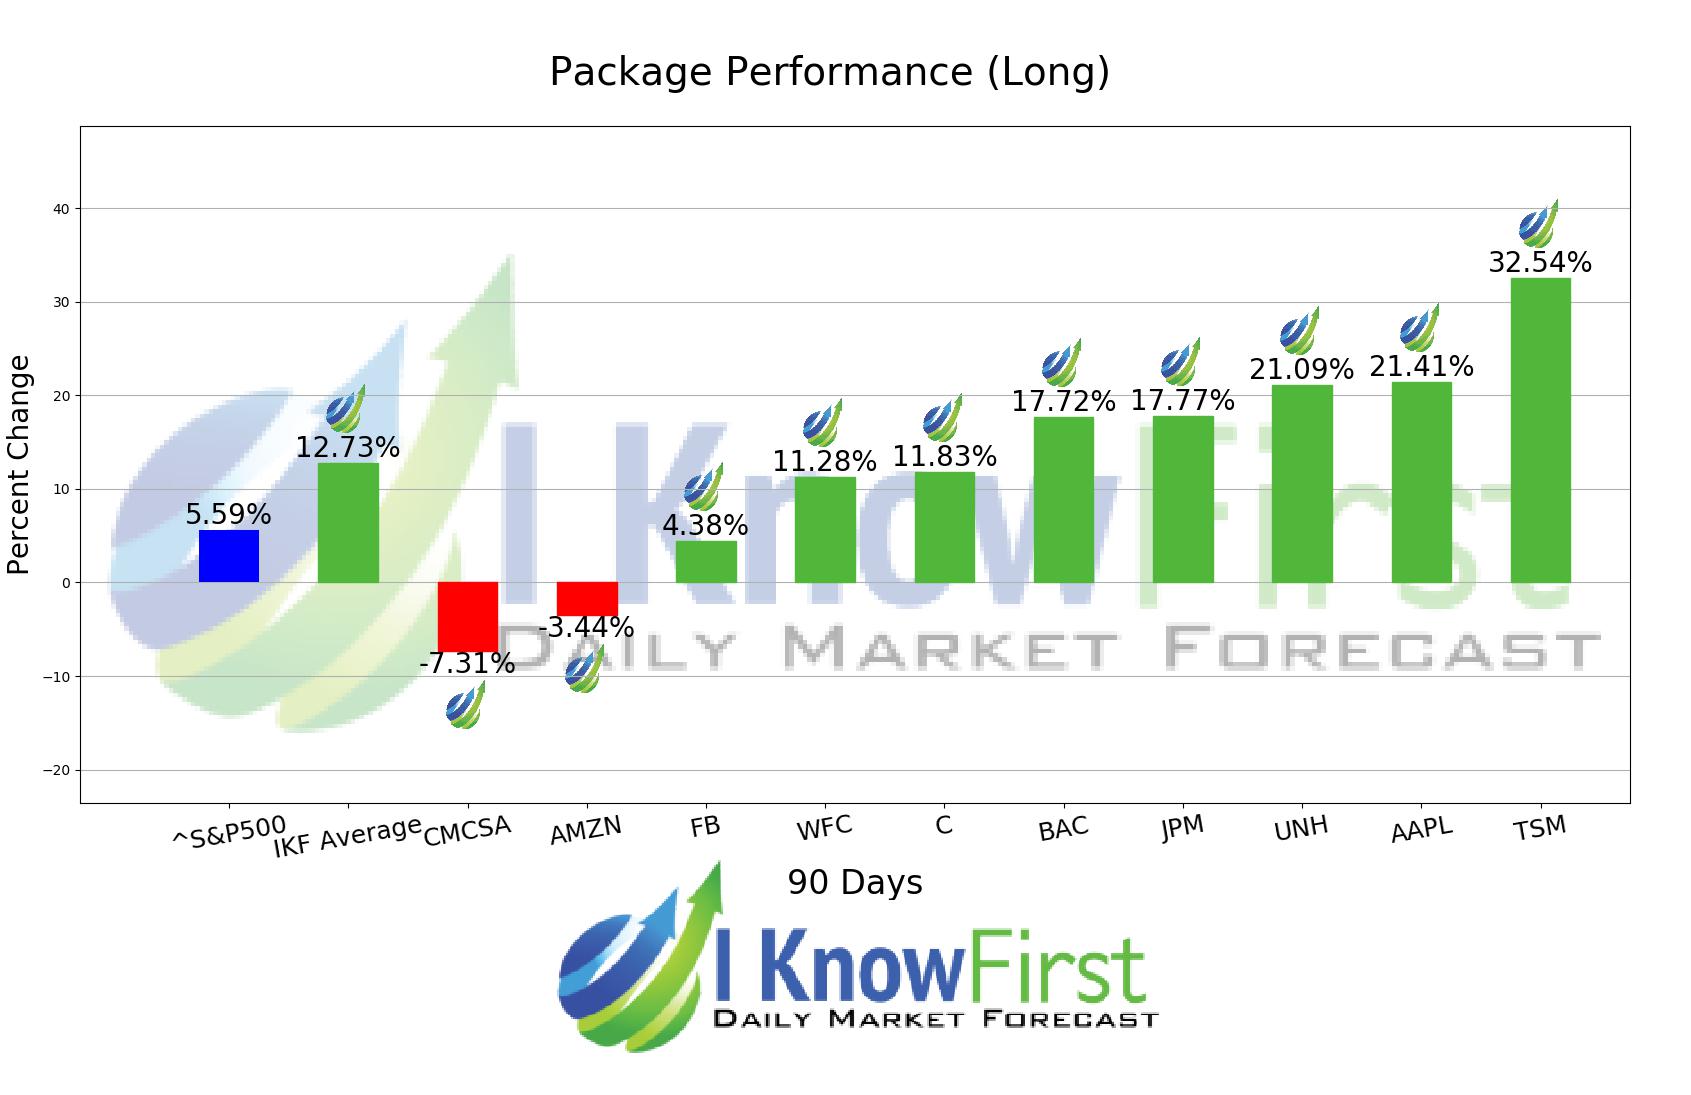
For this 3 Months forecast the algorithm had successfully predicted 8 out of 10 movements. The top-performing prediction in this forecast was TSM, which registered a return of 32.54%. AAPL and UNH saw outstanding returns of 21.41% and 21.09%. The package’s overall average return was 12.73%, providing investors with a 7.14% premium over the S&P 500’s return of 5.59% during the same period.
Taiwan Semiconductor Manufacturing Company Limited engages in the computer-aided design, manufacture, packaging, testing, sale, and marketing of integrated circuits, color filters, and other semiconductor devices. The company is also involved in manufacturing masks; and wholesaling and retailing electronic materials. In addition, it provides marketing and engineering support services; and customer service and technical support services, as well as sells electronic parts and solar related products. The company operates in Taiwan, the United States, Asia, Europe, the Middle East, Africa, and internationally. Taiwan Semiconductor Manufacturing Company Limited was founded in 1987 and is headquartered in Hsinchu, Taiwan.
Algorithmic traders utilize these daily forecasts by the I Know First market prediction system as a tool to enhance portfolio performance, verify their own analysis and act on market opportunities faster. This forecast was sent to current I Know First subscribers.
How to interpret this diagram
Algorithmic Stock Forecast: The table on the left is a stock forecast produced by I Know First’s algorithm. Each day, subscribers receive forecasts for six different time horizons. Note that the top 10 stocks in the 1-month forecast may be different than those in the 1-year forecast. In the included table, only the relevant stocks have been included. The boxes are arranged according to their respective signal and predictability values (see below for detailed definitions). A green box represents a positive forecast, suggesting a long position, while a red represents a negative forecast, suggesting a short position.
Please note-for trading decisions use the most recent forecast. Get today’s forecast and Top stock picks.


