
Mega Cap Stocks Based on Algo Trading: Returns up to 11.0% in 1 Month
Mega Cap Stocks
This stock market forecast includes the best stocks determined by the algorithm with a market capitalization of more than $100 billion.
- Top 10 Mega Cap stocks for the long position
- Top 10 Mega Cap stocks for the short position
Package Name: Mega Cap Forecast
Recommended Positions: Long
Forecast Length: 1 Month (12/4/20 – 1/5/21)
I Know First Average: 1.98%
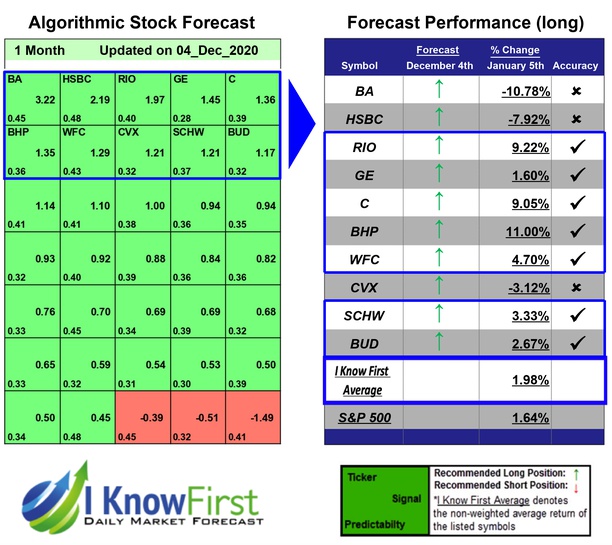
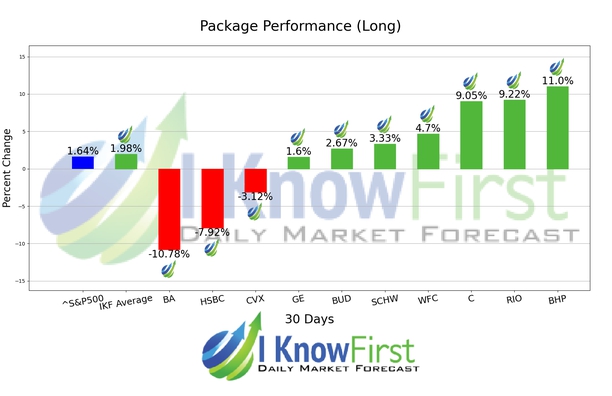
Several predictions in this 1 Month forecast saw significant returns. The algorithm had correctly predicted 7 out 10 stock movements. The highest trade return came from BHP, at 11.0%. RIO and C followed with returns of 9.22% and 9.05% for the 1 Month period. The Mega Cap Forecast package had an overall average return of 1.98%, providing investors with a premium of 0.34% over the S&P 500’s return of 1.64%.
BHP Billiton Limited (BHP) discovers, acquires, develops, and markets natural resources worldwide. It operates through four segments: Petroleum, Copper, Iron Ore, and Coal. The company explores for, develops, produces, and markets oil and gas in the Gulf of Mexico, Western Australia, and Trinidad and Tobago. It also explores for copper, silver, lead, zinc, molybdenum, uranium, gold, iron ore, and metallurgical and thermal coal. The company was formerly known as BHP Limited and changed its name to BHP Billiton Limited (BHP) in July 2001. BHP Billiton Limited (BHP) was founded in 1851 and is headquartered in Melbourne, Australia. BHP Billiton Limited is a subsidiary of BHP Billiton Group.
Algorithmic traders utilize these daily forecasts by the I Know First market prediction system as a tool to enhance portfolio performance, verify their own analysis and act on market opportunities faster. This forecast was sent to current I Know First subscribers.
How to interpret this diagram
Algorithmic Stock Forecast: The table on the left is a stock forecast produced by I Know First’s algorithm. Each day, subscribers receive forecasts for six different time horizons. Note that the top 10 stocks in the 1-month forecast may be different than those in the 1-year forecast. In the included table, only the relevant stocks have been included. The boxes are arranged according to their respective signal and predictability values (see below for detailed definitions). A green box represents a positive forecast, suggesting a long position, while a red represents a negative forecast, suggesting a short position.
Please note-for trading decisions use the most recent forecast. Get today’s forecast and Top stock picks.


