
Market Efficiency: Testing Random Walk by the Runs Test and the Variance Ratio Test
 This “Market efficiency: testing random walk by the runs test and the variance ratio test” article was written by Sergey Okun – Senior Financial Analyst at I Know First, Ph.D. in Economics.
Highlights
- The stock market is not efficient which leaves a place to beat the market in a systematic way.
- The market efficiency can be different from time to time, and the hypothesis of Random Walk cannot be rejected for some periods.
- The I Know First AI algorithm provides us with the tool to select the most promising stocks in the chaotic market.
Efficient Market and Random Walk
The Efficient Market Hypothesis is a cornerstone of classical financial theory. The question of whether markets are efficient or not is the key question that can have an impact on investment strategies and investment behavior. If the stock market is efficient, the market price provides the best estimate of value, and the process of stock valuation becomes one justifying the market price. If the stock market is not efficient, the market price may deviate from the true value, and those who do valuation well will then be able to make higher returns than other investors. An efficient market is one where the market price is an unbiased estimate of the true value of the investment.
Information is the main driver of market efficiency. According to the theory, information that could be used to predict stock performance should already be reflected in stock prices. As soon as there is any information indicating that a stock is underpriced and therefore offers a profit opportunity, investors immediately buy the stock and bid up its price to a fair level, where only ordinary rates of return, which are commensurate with the risk, can be expected. However, if prices are bid immediately to fair levels, given all available information, it must be that they increase or decrease only in response to new information. New information must be unpredictable, if it could be predicted, then the prediction would be part of today’s information. Therefore stock prices that change in response to new unpredictable information also must move unpredictably. This is the essence of the argument that stock prices should follow a random walk, that is, price changes should be random and unpredictable. Random Walk theory suggests that changes in stock prices have the same distribution and are independent of each other. Therefore, it assumes the past movement or trend of a stock price or market cannot be used to predict its future movement. So, let us try to answer the question of whether the S&P500 daily returns follow Random Walks or not by testing the mean and variance parameters for the period from January 3rd, 1928 to June 1st, 2022.
Runs Test
Abraham Wald and Jacob Wolfowitz have developed a non-parametric statistical test (the Runs Test) that checks a randomness hypothesis for a two-valued data sequence. The idea of the Runs Test is to check runs (sequences) of positive and negative returns in a series and see whether a future positive or negative return is independent of a past return. So, we need to identify if an expected number of runs of returns follows Random Walk. According to Figure 1, the Runs Test statistics follow a normal distribution with mean and variance.
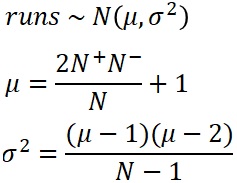
(Figure 1: Parameters for the Runs Test)
According to Figure 2, we can notice that the number of positive days is higher than that of negative days for the S&P500 from January 3rd, 1928, to June 1st, 2022. Moreover, we can see that the actual observable number of runs is 11298, which is less than the expected number of runs of 11794.42. However, we need to see whether this difference is statistically significant or not, which allows us to determine whether the series of the S&P500 returns follows the Random Walk process or not. According to Z-Statistica of -6.48 and the P-Value of 0.00%, we can conclude that there is a 0% chance that the S&P500 returns follow Random Walk and this enables us to conclude that the US stock market is not efficient.

Let us check if the market is consistently inefficient or if it is inefficient from time to time. In Figure 3, you can notice the dynamic of the P-Value of the Runs Test for the S&P500 daily returns with the rolling window of 5-year (1253 trading days).

According to Figure 3, we cannot say that the market is totally inefficient, and we see that the market efficiency can be different from time to time. For example, we cannot reject the hypothesis of Random Walk for the period of 1986-1996 or 2012-2016. Moreover, we can notice that currently, the P-Value is increasing from June 2021.
Variance Ratio Test
The Variance Ratio test has been developed by Lo and MacKinlay and it checks Random Walks by analyzing the variance of stock returns. The idea of the test is to exploit variant scaling under the independent assumption. When k random variables are independent and identically distributed, then the variance of the sum of these k random variables would be k times the variance of 1 of those variables. So to check the assumption that the future stock returns are not influenced by past stock returns, we need to test if a variance of returns over some k day intervals is exactly equal to the variance of the daily stock returns times k where k is a blank of this chosen interval. According to Figure 4, the Variance Ratio statistics follows a normal distribution with a mean of 0 and variance.

(Figure 4: Parameters for the Variance Ratio Test)
According to Figure 5, we can reject the hypothesis of Random Walk based on the P-Value for the intervals of 2, 4, 8, and 128 trading days which enables us to conclude that the US stock market is not efficient.

Let us check if the market is consistently inefficient or if it is inefficient from time to time. In Figure 6, you can notice the dynamic of the P-Value of the Variance Ratio Test for the S&P500 daily returns with the rolling window of 5 years (1253 trading days).
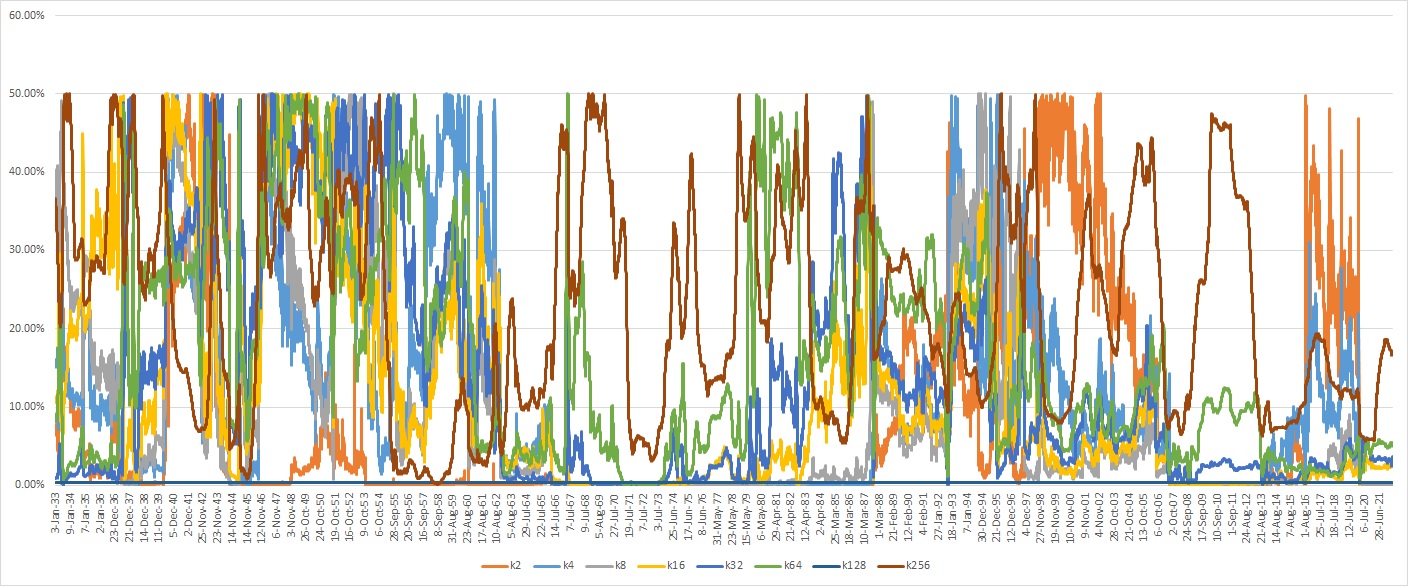
According to Figure 6, we can reject the hypothesis of Random Walk based on the P-Value dynamic.
Investment with the I Know First AI Algorithm
Overall, the stock market is not efficient, which leaves a place to beat the market in a systematic way. However, we can notice that we cannot reject the Random Walk hypothesis for some time periods. Actually, it looks like the stock market has a chaotic behavior and it is where the I Know First AI algorithm can help to find the most promising investment opportunities.

I Know First is one leading company that has been effectively using machine learning and AI-based algorithms to provide daily forecasts and facilitate trading for over 10,500 financial instruments. More importantly, I Know First’s algorithm can fulfill the idea of discovering “fractals” and patterns using a more accurate way through AI and machine learning without involving any human judgments. The algorithms can present historical price patterns based on the data inputs, testing the performance on years of market data, and validating them on the most recent data to prevent overfitting. If an input does not improve the model, it is “rejected”, and another input can be submitted. I Know First provides different forecast packages based on the AI algorithm which allows us to select the most promising stocks (you can access them here). For example, below you can see the investment result of our Chemical Stocks package which was recommended to our clients for the period from December 25th, 2020 to June 10th, 2022.

The investment strategy that was recommended by I Know First accumulated a return of 84.91%, which exceeded the S&P 500 return by 76.41%.
Conclusion
The stock market is not efficient, which leaves a place to beat the market in a systematic way. However, it is also not correct to say that the stock market is completely inefficient for all periods. According to the P-Value dynamic of the Runs test and the Variance Ratio test with the 5-year rolling window, we can notice that the market efficiency can be different from time to time, and the hypothesis of Random Walk cannot be rejected for some periods. Actually, the stock market seems to have chaotic behavior, and it is where the I Know First AI algorithm can help to find the most promising investment opportunities.

To subscribe today click here.
Please note-for trading decisions and use the most recent forecast.


