
Japan Stocks Based on Predictive Analytics: Returns up to 14.34% in 7 Days
Japan Stocks
This forecast is part of the By Country Package, as one of I Know First’s algorithmic trading tools. The full forecast includes daily predictions for a total of 20 Japan stocks with bullish and bearish signals:
- Top 10 Japanese stocks for the long position
- Top 10 Japanese stocks for the short position
Package Name: By Country – Japanese Stocks
Recommended Positions: Long
Forecast Length: 7 Days (1/27/21 – 2/3/21)
I Know First Average: 2.41%
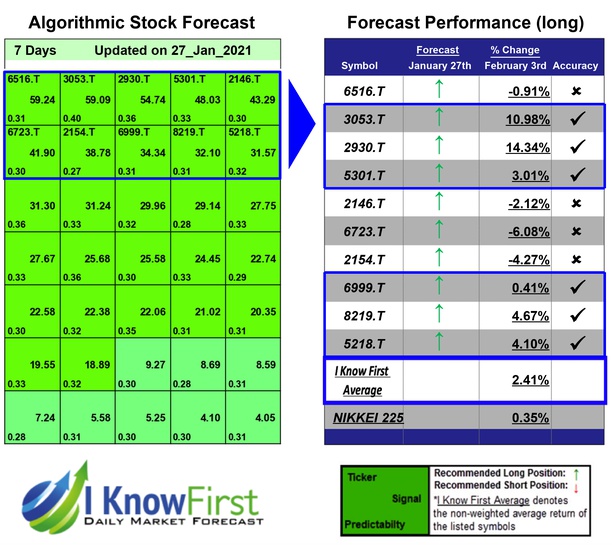

This By Country – Japanese Stocks Package forecast had correctly predicted 6 out of 10 stock movements. The greatest return came from 2930.T at 14.34%. 3053.T and 8219.T followed with returns of 10.98% and 4.67% for the 7 Days period. The package had an overall average return of 2.41%, providing investors with a 2.06% premium over the Nikkei 225 return of 0.35% during the period.
Kitanotatsujin Corporation is a Japan-based company mainly engaged in the e-commerce business. The Company is mainly engaged in the sale of health foods and beauty-related products through Internet, and the operation of related businesses, such as the order receipt and shipment business, the production of mail order Websites, the plan and production of sales promotion tools, as well as the development of systems. The Company provides its products through mail order Websites http://www.kaitekikobo.jp/ and http://www.kaitekikobo.jp/sp/ operated by the Company.
Algorithmic traders utilize these daily forecasts by the I Know First market prediction system as a tool to enhance portfolio performance, verify their own analysis and act on market opportunities faster. This forecast was sent to current I Know First subscribers.
How to interpret this diagram
Algorithmic Stock Forecast: The table on the left is a stock forecast produced by I Know First’s algorithm. Each day, subscribers receive forecasts for six different time horizons. Note that the top 10 stocks in the 1-month forecast may be different than those in the 1-year forecast. In the included table, only the relevant stocks have been included. The boxes are arranged according to their respective signal and predictability values (see below for detailed definitions). A green box represents a positive forecast, suggesting a long position, while a red represents a negative forecast, suggesting a short position.
Please note-for trading decisions use the most recent forecast. Get today’s forecast and Top stock picks.


