
IWF/IWD Stock Forecast for 2022: Growth vs Value in the Pandemic Realities
 This “IWF/IWD Stock Forecast for 2022: Growth vs Value in the Pandemic Realities” article was written by Sergey Okun – Senior Financial Analyst at I Know First, Ph.D. in Economics.
Highlights:
- Low-interest rates provide a more favorable environment for the Growth Stocks than for the Value Stocks in the pandemic time.
- The IWF/IWD spread is equal to 1.67 corresponding to the numbers during the Dotcom bubble, and significantly higher than its historical mean and median numbers of 1.10 and 1.01, respectively.
- Expected changes in the monetary policy can have a strong impact on the IWF/IWD spread with the increasing strength of the Value Stocks.
Covid-19, which introduced itself at the beginning of 2020, has had a dramatic effect on our everyday life and created a new reality for the function of the global economic system in the pandemic frame. Lockdowns and government restrictions had a dramatic impact on business activity, which created a negative economic environment in which companies had to adapt taking into account their business specifics. Covid-19 also harmed the stock market, where the S&P 500 dropped by 34% from February 20th to March 23rd, 2020. At the same time, Covid-19 had a different influence on stocks based on their specifics. For instance, IWF (It is a growth stocks ETF of US large- and midcap stocks selected from the Russell 1000 Index) decreased by 31%, while IWD (It is a value stocks ETF of US large- and midcap stocks selected from the Russell 1000 Index) decreased by 38% from February 20th to March 23rd, 2020. Moreover, ETF IWF and ETF IWD rose by 45% and 20% respectively from 20th February 2020 to 8th February 2022.
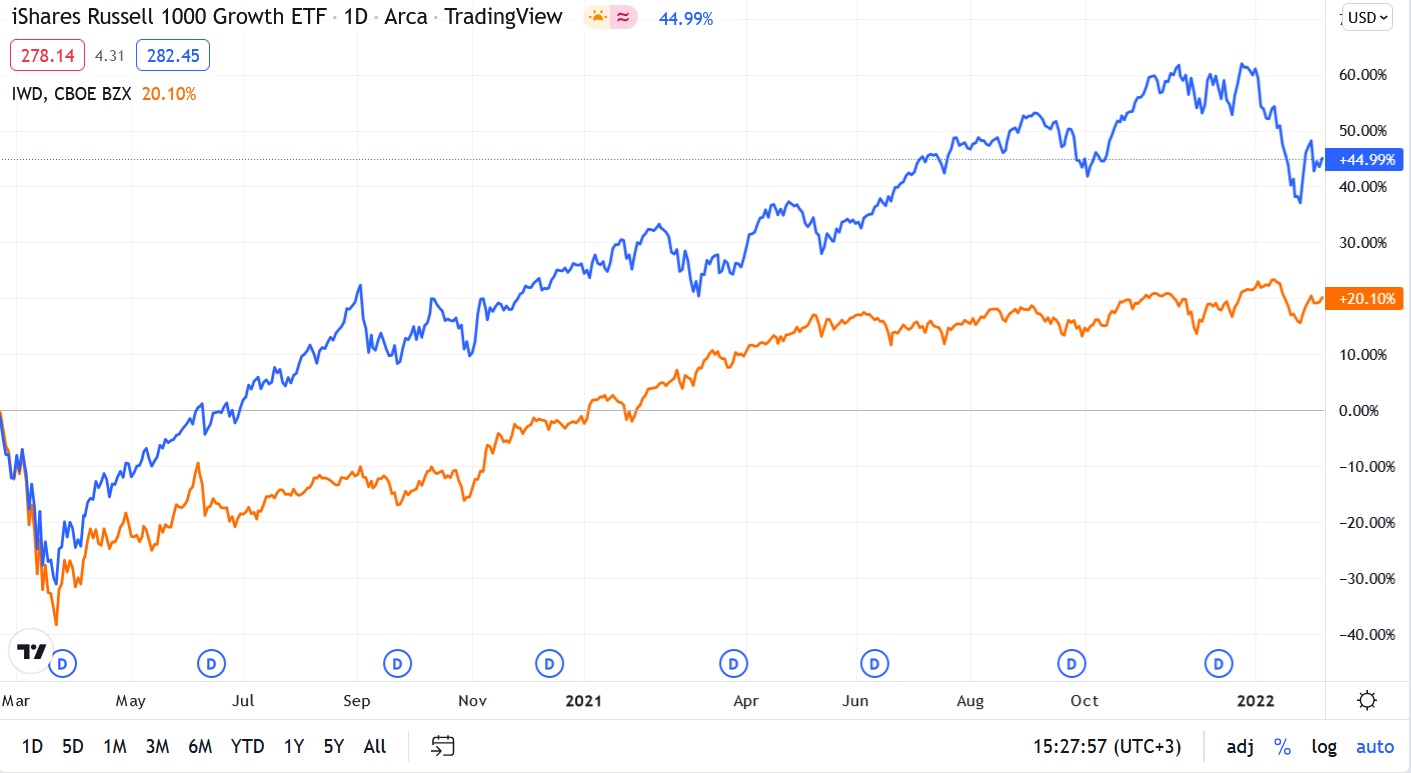
(Figure 1: Price Dynamics of ETF IWF and ETF IWD for the Period of 20th February 2020 – 8th February 2022)
The stock market is the market of expectations about future company’s free cash flow on one side, and the cost of capital on the other side. The time distribution of a free cash flow, which is earned by a company, is the main factor putting the line between Growth and Value Stocks. The main part in the pricing of the Value Stocks takes a free cash flow which is expected to be earned in the nearest future, while the main part in the pricing of the Growth Stocks takes a free cash flow which is expected to be earned in the distant future. This fact about the distribution of the expected free cash flow explains why the Growth Stocks (ETF IWF decreased by 31% from February 20th – March 23rd, 2020) lost their value less than the Value Stocks (ETF IWD decreased by 38% from February 20th – March 23rd, 2020) at the beginning of the pandemic, because of a threat of lockdowns and government restrictions on economic activity had a more negative influence on the expected free cash flow in the nearest financial periods.
Overall, the growth of ETF IWD and ETF IWF by 20% and 45% are connected with government support of the economy by increasing the money supply (M2 increased by 40% from February 2020 to November 2021) and decreasing interest rates (the 10-years Treasury yield decreased from 1.8820 on January 1st, 2020 to at the lowest level of 0.5360 on August 6, 2020). The nearest free cash flow, that is expected to be earned by a company, has a higher value than a further one. At the same time, decreasing interest rates contribute to a smaller loss of each free cash flow at a point in time by comparison to the previous one, which decreases a fraction of the nearest expected free cash flow and increases a fraction of further ones in the stock valuation. In other words, when interest rates are low, a free cash flow, which is in a more distant future, takes a bigger fraction in the stock valuation than when interest rates are high.
Let us look carefully at the statistics description of ETF IWD and ETF IWF. Below, I calculated the mean and volatility of monthly return (by using monthly adjusted closed prices from YahooFinance.com) for the period of June 2000 – January 2022. According to Table 1, ETF IWF is a riskier asset with a high grade of risk compared with ETF IWD. Moreover, we can notice that the spread return of IWF/IWD is equal to -0.03% with a volatility of 2.80%.

The historical monthly average IWF/IWD spread is equal to 1.10 with a median of 1.01 for the period of June 2000 – January 2022, which is less than the current spread of 1.67 on February 8th, 2022. We can also notice that the current level of the IWF/IWD spread corresponds to the numbers at the beginning of 2000 when there was a Dotcom bubble. Moreover, the spread sharply increased in February 2020 with decreasing 10-years Treasury yield (TNX).

Looking at our previous consideration, the interest rate dynamic is a factor that can explain the dynamic of the IWF/IWD spread. However, let us look at the following questions: 1. What is the historical connection between the interest rate and IWF/IWD spread?; 2. How strong is this connection now?
Historically, the monthly correlation between the return of IWF/IWD and the return of TNX is small and equal to -0.12 for the period of June 2000 to January 2022, which also supports the fact that decreasing interest rates contribute to a high stimulus for the rising of the Growth Stocks compared with the Value Stocks and vice versa. However, there are a lot of different factors which can have an impact on the stock market in different periods of time with different strengths, and the interest rate is not an exception. In Figure 3 we can notice that the correlation between TNX and the IWF/IWD spread is not consistent, there was a positive correlation coefficient until July 2007 and between February 2008 – February 2012. Moreover, the correlation between TNX and IWF/IWD negatively increased when the pandemic began and reached its historical negative level of -0.57. This fact allows us to sum up that interest rates have a significant impact on IWF/IWD spread in the pandemic time, which is higher than before.

Based on our previous discussion that decreasing interest rates provide a significant impulse for the rise of IWF/IWD spread, we can assume that increasing interest rates will have a significant negative impact on the spread dynamic in the future. Rising inflation provokes the Fed to increase interest rates, but the main questions are when and how the Fed will do it. As we said before in one of our previous articles, the market has to see that the FED and the US Government can get the same macroeconomic position and can create an effective plan to deal with inflation in the pandemic environment. Otherwise, policy actions will create additional levels of uncertainty that increase market volatility. According to Bloomberg, the bond market pricing now implies as many as five rate increases in 2022.

As we have said before, government support is the main factor that contributes to the stock market growth in the pandemic time and possible changes in this monetary policy could cause a surge in volatility, as we saw before the FOMC’s meeting on January 26th, 2022. However, the FOMC’s statement to keep the target range for the federal funds rate at 0 to 1/4 percent, and the amazing Apple’s quarterly financial report calmed the market and provided an additional grade of optimism. However, we need to take into account that the perfect Apple’s earning report does not mean that quarterly results of other companies will beat Wall Street estimates, because firstly not every company had enough resources and influence to overwhelm the shortage crisis as Apple did in the last quarter, and secondly, despite the fact that the FOMC decided not to increase the federal funds rate (they expect to do it in the near future) the current 10-years Treasury yield is equal to 1.9540 that correspond with the level before the pandemic. Moreover, the FOMC also decided to continue to reduce the monthly pace of its net asset purchases, bringing them to an end in early March.

(Figure 4: The VIX dynamic from December 20th, 2021 to February 8th, 2022)
Let us look at the I Know First AI outlook. Currently, the algorithm has strong positive signals for both IWF and IWD on the 1-year horizon with a higher signal for IWF than for IWD. Moreover, it is interesting to see that the AI outlook has changed since the FOMC’s meeting, where on January 24th, 2022 the algorithm provided a higher strong signal for IWD than for IWF.


I suppose that a future decrease of government support will have a negative impact on the IWF/IWD spread considering going short in IWF and going long in IWD. However, my position goes in contradiction with the last I Know First AI forecast from February 8th, 2022 that provides a positive outlook on the IWF/IWD spread (going long in IWF with a higher signal and going short in IWD with a lower signal). To be fair, we need to remember that the FED has spoken about the necessity of increasing interest rates to deal with inflation since April 2021, and the possibility that the FED will not dramatically decrease the market support for the next twelve months explains I Know First algorithmic outlook for the spread of IWF/IWD. Also, we need to take into account that the algorithmic outlook changed after the last FOMC meeting and the algorithm could capture other factors which could come into the game and could have a significant impact on the future stock market dynamic.
Conclusion
The decreasing interest rates provide a significant impulse for growth of the Growth Stock compared with the Value Stocks in the previous two years. Currently, the IWF/IWD spread is equal to 1.67 which is significantly higher than the historical monthly mean and median numbers of 1.10 and 1.01 respectively, and correspond with the numbers during the Dotcom bubble at the beginning of 2000. However, changing the monetary policy can have a significant impact on the stock market in general and on the IWF/IWD spread in particular with the increasing strength of the Value Stocks.
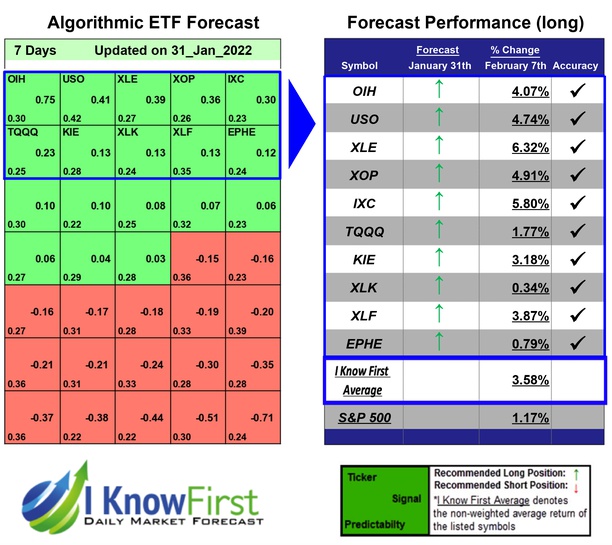
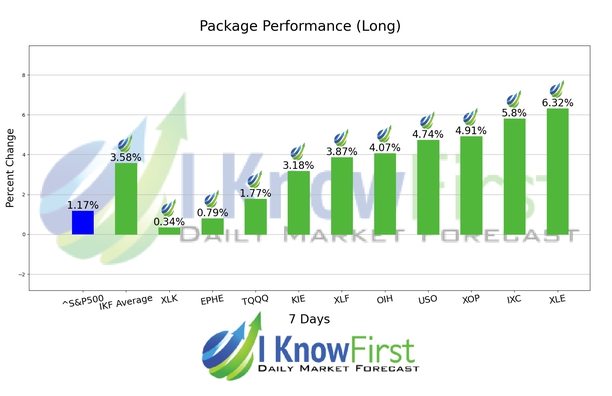
I Know First has developed the ETFs Forecast Package to help our client to determine the most promising investment areas. This ETFs Forecast Package had correctly predicted 10 out of 10 stock movements. XLE was the highest-earning trade with a return of 6.32% in 7 Days. IXC and XOP saw outstanding returns of 5.80% and 4.91%. The package’s overall average return was 3.58%, providing investors with a 2.41% premium over the S&P 500’s return of 1.17% during the same period.
To subscribe today click here.
To learn more about I Know First and the solutions we offer, visit our website


