
Israeli Stocks Based on Stock Algorithm: Returns up to 57.32% in 3 Months
Israeli Stocks
This forecast is part of the By Country Package, as one of I Know First’s algorithmic trading tools. The full forecast includes daily predictions for a total of 20 stocks with bullish and bearish signals:
- Top 10 Israeli stocks for the long position
- Top 10 Israeli stocks for the short position

Package Name: By Country – Israeli Stocks
Recommended Positions: Long
Forecast Length: 3 Months (6/5/2019 – 9/5/2019)
I Know First Average: 16.17%
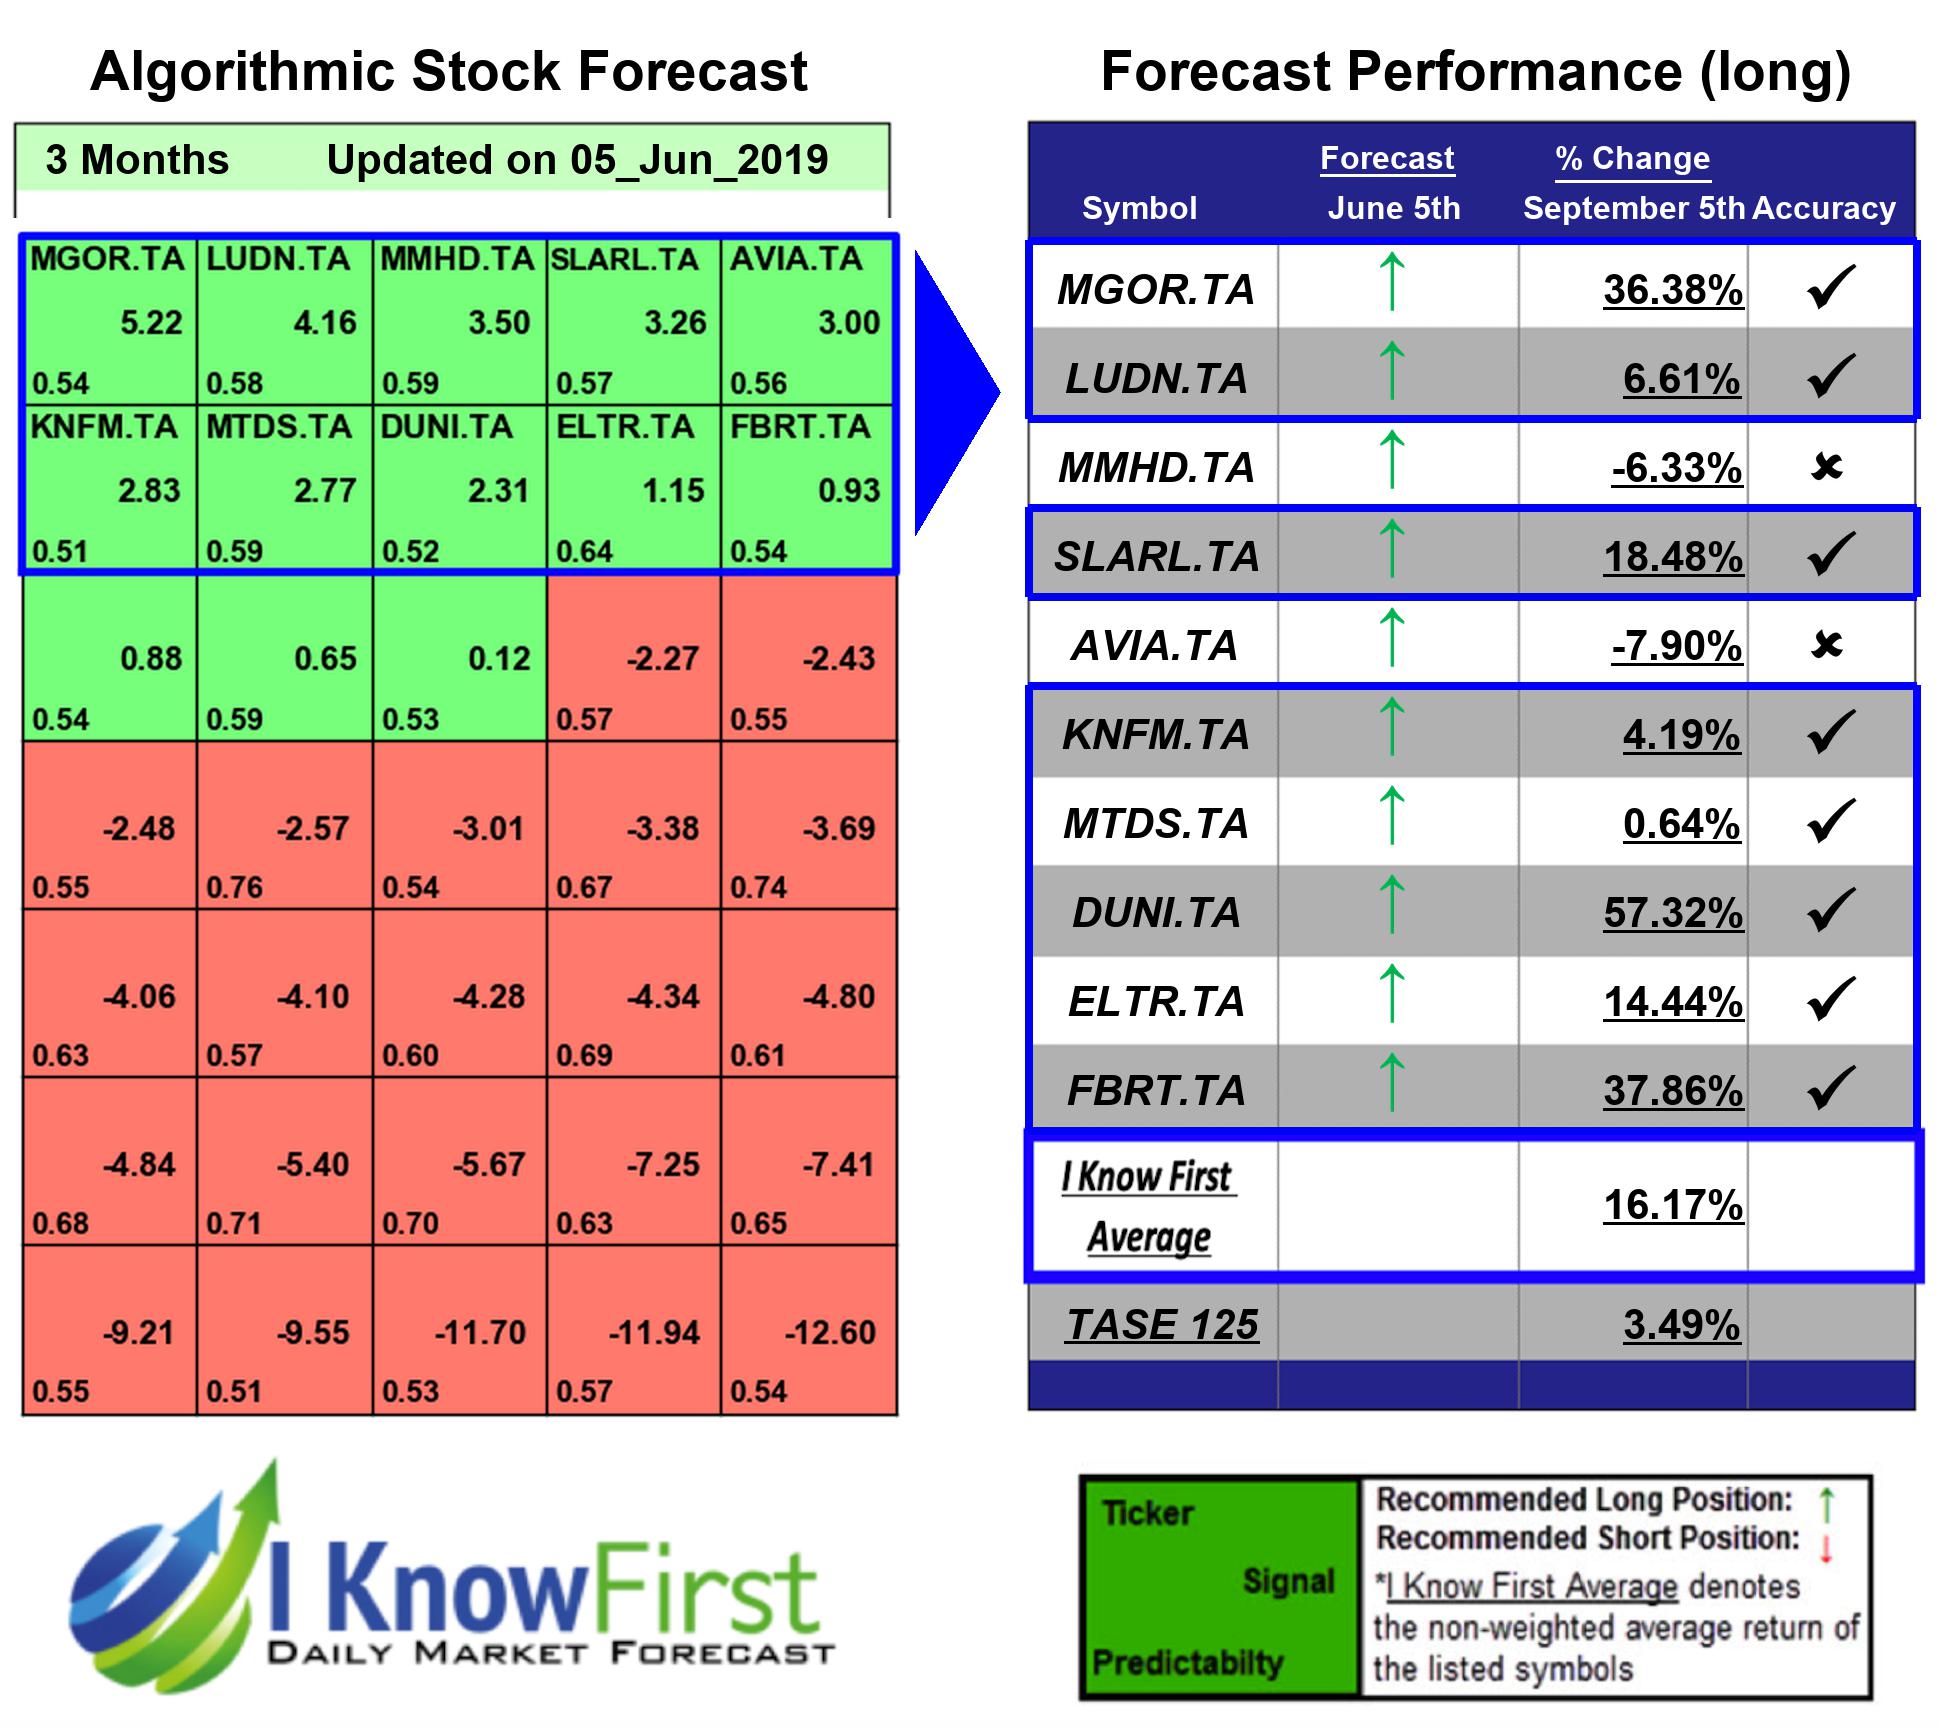
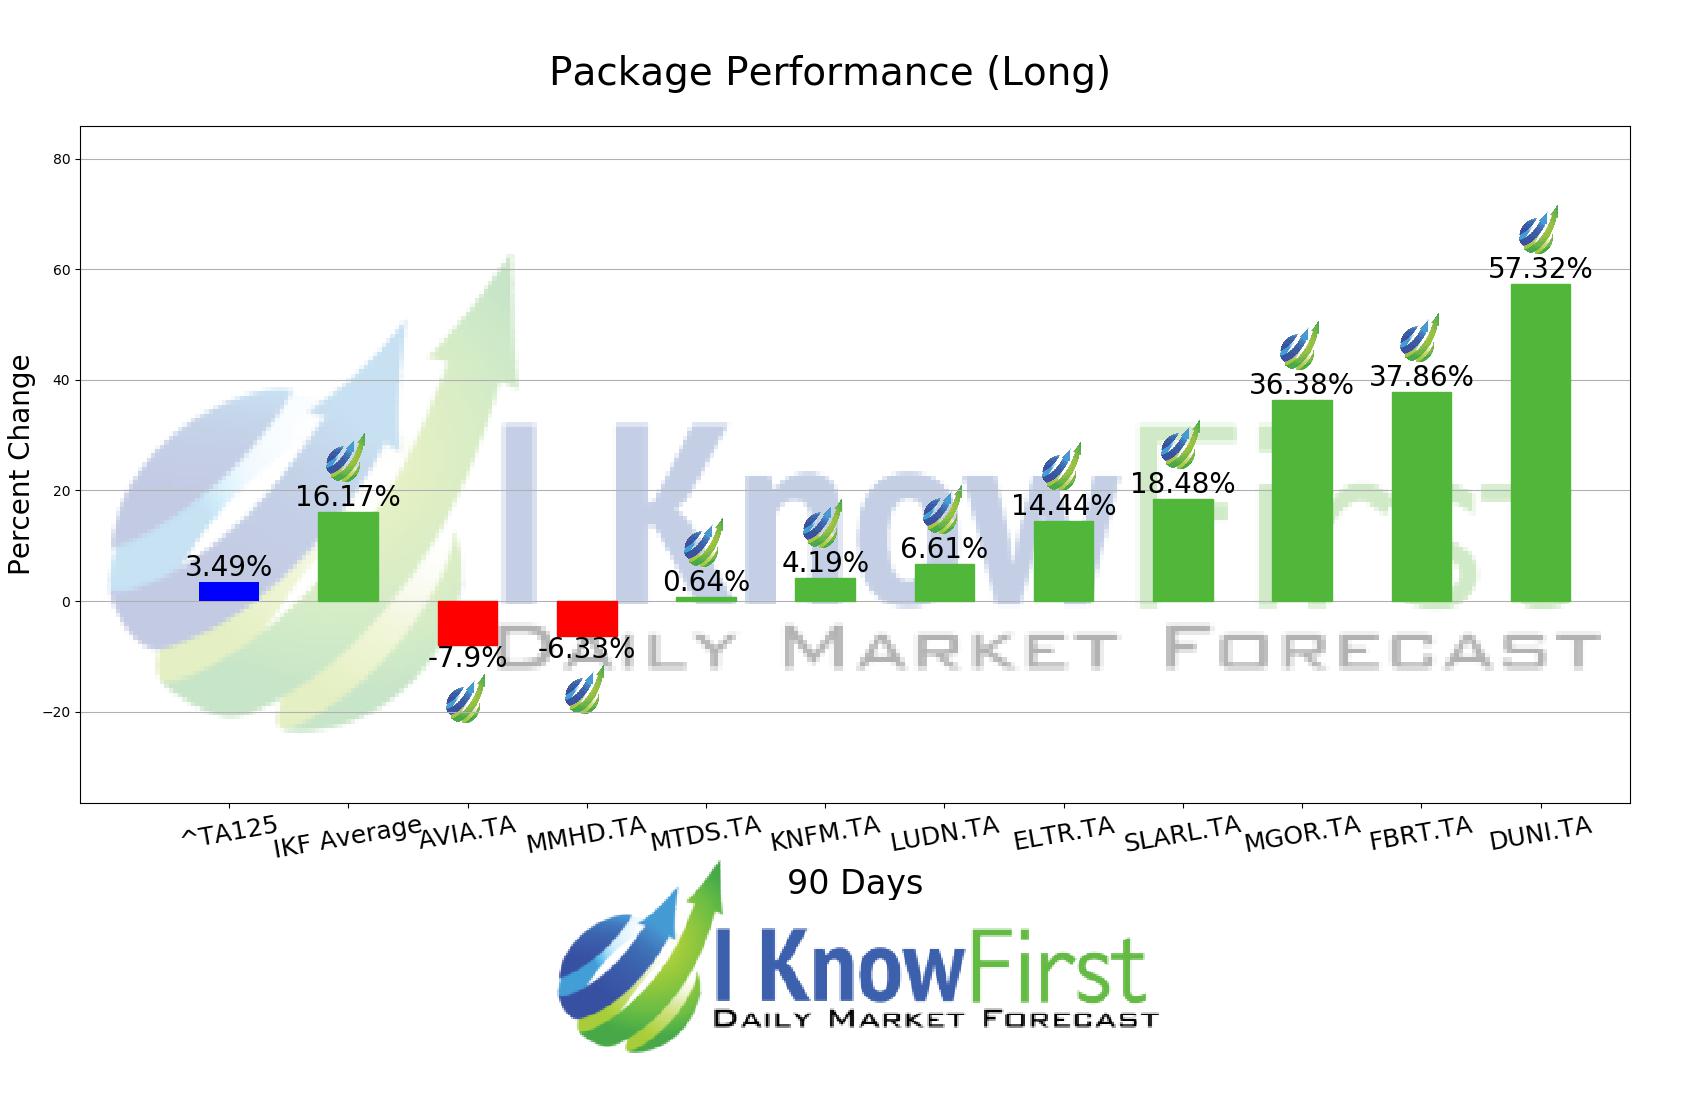
For this 3 Months forecast the algorithm had successfully predicted 8 out of 10 movements. DUNI.TA was our best stock pick this week a return of 57.32%. FBRT.TA and MGOR.TA followed with returns of 37.86% and 36.38% for the 3 Months period. The package had an overall average return of 16.17%, providing investors with a 12.68% premium over the TASE 125 return of 3.49% during the period.
Duniec Bros. Ltd. is an Israel-based construction company. The Company, directly and through its subsidiaries, initiates, designs, develops, constructs and operates multifamily residential projects, builds multiple buildings at each project including recreation and commercial centers and sport clubs. The Company is registered as a certified and licensed builder, and a member of the Contractors and Builders Association in Israel. In September 2011, the Company acquired real estate land in the city of Ashdod, located in Israel.
Algorithmic traders utilize these daily forecasts by the I Know First market prediction system as a tool to enhance portfolio performance, verify their own analysis and act on market opportunities faster. This forecast was sent to current I Know First subscribers.
How to interpret this diagram
Algorithmic Stock Forecast: The table on the left is a stock forecast produced by I Know First’s algorithm. Each day, subscribers receive forecasts for six different time horizons. Note that the top 10 stocks in the 1-month forecast may be different than those in the 1-year forecast. In the included table, only the relevant stocks have been included. The boxes are arranged according to their respective signal and predictability values (see below for detailed definitions). A green box represents a positive forecast, suggesting a long position, while a red represents a negative forecast, suggesting a short position.
Please note-for trading decisions use the most recent forecast. Get today’s forecast and Top stock picks.


