
Interest Rate Outlook Based on Algo Trading: Returns up to 10.53% in 7 Days
Interest Rate Outlook
The Interest Rate Package includes Interest Rate Outlook with predictions for various interest rates based on the I Know First algorithm.
Package Name: Interest Rates Forecast
Recommended Positions: Long
Forecast Length: 7 Days (7/6/21 – 7/13/21)
I Know First Average: 1.03%
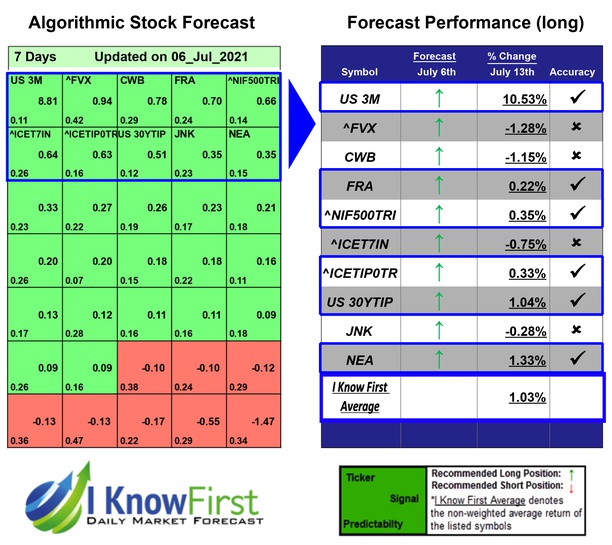
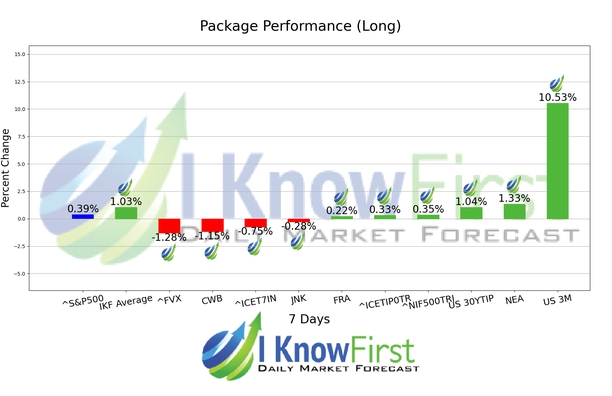
I Know First’s State of the Art Algorithm accurately forecasted 6 out of 10 interest rates in this Interest Rates Forecast Package for the 7 Days time period. US 3M was our best stock pick this week a return of 10.53%. NEA and US 30YTIP saw outstanding returns of 1.33% and 1.04%. The package saw an overall yield of 1.03% versus the S&P 500’s return of 0.39% implying a market premium of 0.64%.
Algorithmic traders utilize these daily forecasts by the I Know First market prediction system as a tool to enhance portfolio performance, verify their own analysis and act on market opportunities faster. This forecast was sent to current I Know First subscribers.
How to interpret this diagram
Algorithmic Interest Rate Forecast: The table on the left is the interest rate forecast produced by I Know First’s algorithm. Each day, subscribers receive forecasts for six different time horizons. Note that the top 10 interest rates in the 1-month forecast may be different than those in the 1-year forecast. In the included table, only the relevant interest rates have been included. The boxes are arranged according to their respective signal and predictability values (see below for detailed definitions). A green box represents a positive forecast, suggesting a long position, while a red represents a negative forecast, suggesting a short position.
Signal: This indicator represents the predicted movement direction/trend; not a percentage or specific target price. The signal strength indicates how much the current price deviates from what the system considers an equilibrium or “fair” price.
Predictability: This value is obtained by calculating the correlation between the current prediction and the actual asset movement for each discrete time period. The algorithm then averages the results of all the prediction points, while giving more weight to recent performance. As the machine keeps learning, the values of P generally increase.
Please note-for trading decisions use the most recent forecast. Get today’s forecast and Top stock picks.


