
Implied Volatility Options Based on AI: Returns up to 364.25% in 1 Year
Implied Volatility Options
The Implied Volatility Options Package is designed for investors and analysts who need predictions for options trading. It includes 20 stock options with bullish and bearish signals and indicate the best options to buy and sell:
- Implied volatility Top 10 call options
- Implied volatility Top 10 put options

Package Name: Implied Volatility Options
Recommended Positions: Long
Forecast Length: 1 Year (6/7/20 – 6/8/21)
I Know First Average: 193.28%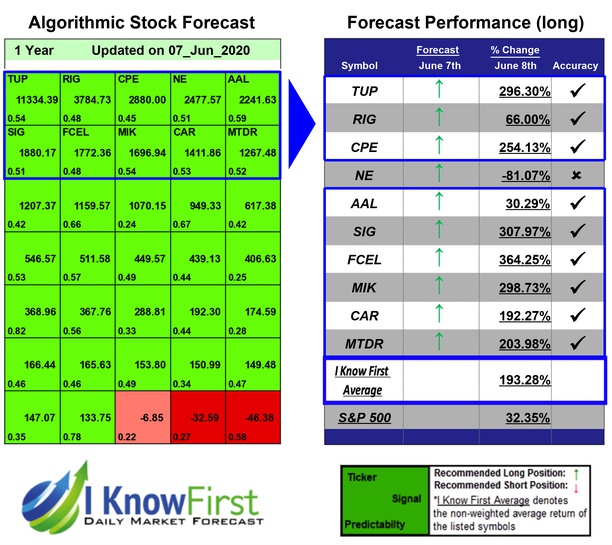
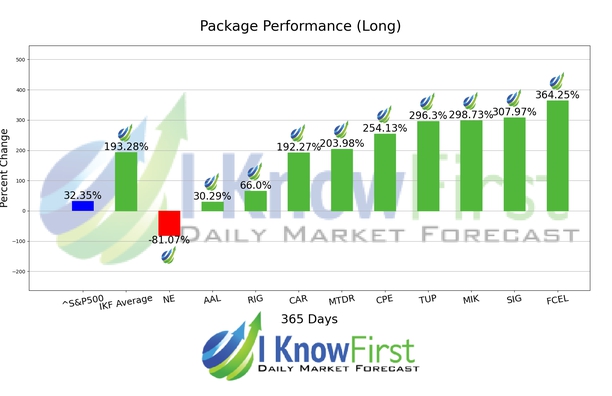
The algorithm correctly predicted 9 out 10 of the suggested trades in the package for this 1 Year forecast. The top-performing prediction in this forecast was FCEL, which registered a return of 364.25%. SIG and MIK followed with returns of 307.97% and 298.73% for the 1 Year period. The package had an overall average return of 193.28%, providing investors with a premium of 160.93% over the S&P 500’s return of 32.35% during the same period.
FuelCell Energy, Inc., together with its subsidiaries, designs, manufactures, sells, installs, operates, and services stationary fuel cell power plants for distributed power generation.
Algorithmic traders utilize these daily forecasts by the I Know First market prediction system as a tool to enhance portfolio performance, verify their own analysis and act on market opportunities faster. This forecast was sent to current I Know First subscribers.
How to interpret this diagram
Algorithmic Stock Forecast: The table on the left is a stock forecast produced by I Know First’s algorithm. Each day, subscribers receive forecasts for six different time horizons. Note that the top 10 stocks in the 1-month forecast may be different than those in the 1-year forecast. In the included table, only the relevant stocks have been included. The boxes are arranged according to their respective signal and predictability values (see below for detailed definitions). A green box represents a positive forecast, suggesting a long position, while a red represents a negative forecast, suggesting a short position.
Please note-for trading decisions use the most recent forecast. Get today’s forecast and Top stock picks.


