
Implied Volatility Based on Artificial Intelligence: Returns up to 24.54% in 3 Days
Implied Volatility
The Implied Volatility Options Package is designed for investors and analysts who need implied volatility predictions for options trading. It includes 20 stock options with bullish and bearish signals for implied volatility and indicates the best options to buy and sell:
- Implied volatility Top 10 call options
- Implied volatility Top 10 put options

Package Name: Implied Volatility Options
Recommended Positions: Long
Forecast Length: 3 Days (9/11/2020 – 9/15/2020)
I Know First Average: 2.91%
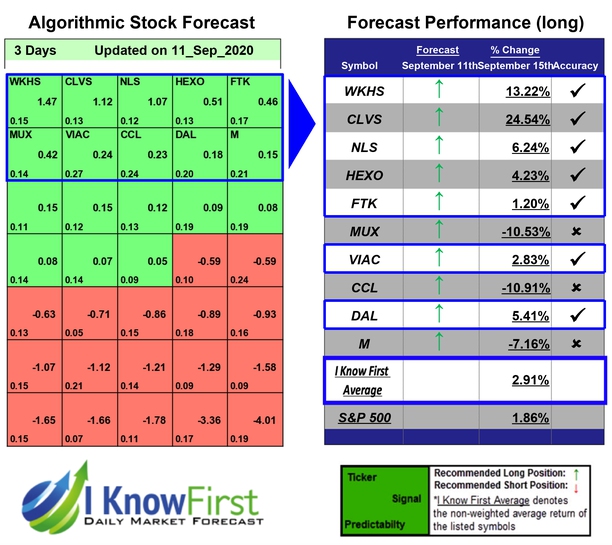
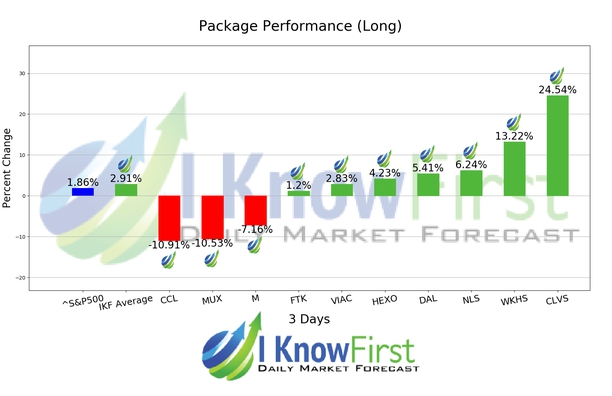
During the 3 Days forecasted period several picks in the Implied Volatility Options Package saw significant returns. The algorithm had correctly predicted 7 out 10 returns. The greatest return came from CLVS at 24.54%. WKHS, and NLS had notable returns of 13.22% and 6.24%. The package itself saw an overall return of 2.91%, providing investors with a 1.05% premium above the S&P 500’s return of 1.86% for the same time period.
Clovis Oncology, Inc., incorporated on April 20, 2009, is a biopharmaceutical company focused on acquiring, developing and commercializing anti-cancer agents in the United States, Europe and other international markets. The Company’s product candidates include Rociletinib, Rubraca (Rucaparib) and Lucitanib. Its commercial product Rucaparib is an oral, small molecule poly adenosine diphosphate (ADP)-ribose polymerase (PARP), inhibitor of PARP1, PARP2 and PARP3 approved in the United States by the Food and Drug Administration (FDA), as monotherapy for the treatment of patients with deleterious breast cancer (BRCA) (human genes associated with the repair of damaged deoxyribonucleic acid (DNA)) mutation (germline and/or somatic) associated advanced ovarian cancer, who have been treated with two or more chemotherapies, and selected for therapy based on an FDA-approved companion diagnostic for Rubraca.
Algorithmic traders utilize these daily forecasts by the I Know First market prediction system as a tool to enhance portfolio performance, verify their own analysis and act on market opportunities faster. This forecast was sent to current I Know First subscribers.
How to interpret this diagram
Algorithmic Stock Forecast: The table on the left is a stock forecast produced by I Know First’s algorithm. Each day, subscribers receive forecasts for six different time horizons. Note that the top 10 stocks in the 1-month forecast may be different than those in the 1-year forecast. In the included table, only the relevant stocks have been included. The boxes are arranged according to their respective signal and predictability values (see below for detailed definitions). A green box represents a positive forecast, suggesting a long position, while a red represents a negative forecast, suggesting a short position.
Please note-for trading decisions use the most recent forecast. Get today’s forecast and Top stock picks.


