
Humanity’s Age Old Obsession: Gold Price Predictions

This gold price predictions article was written by Michael Shpits, a Financial Analyst at I Know First.
Summary:
- Gold, an ancient staple of what humans have considered wealth, is often surrounded by misconceptions on possible correlations.
- M2 money supply correlation to gold falls apart in larger context.
- Fabrication demand and investor behavior do not effectively explain gold price change in the long-term.
- Interest rates and inflation may be the driving force behind gold’s price hike in recent years.
- Correlation seems to exist between the precious metal and monetary demand, closely related to faith in banks.
- Gold remains a strong asset for risk mitigation and volatility smoothing.
It covered the Ancient Israelites’ Ark of the Covenant. It acted as the vessel through which Mansa Musa’s generosity was expressed on his pilgrimage to Mecca. Our presidents’ faces continue to be printed on its shiny surface. Gold has remained a staple of what humans consider to be wealth for millennia. Yet the age old question remains, is it its own agent, or can it be tracked alongside a partnering indicator?
Money Supply on Gold Price
Well from first glance, it appears as though gold has a strong correlation with M2 money supply (money supply including cash, checking and savings deposits, money market securities, mutual funds, and similar near money counts).

In fact, when studying the time frame from a larger context, it seems as though macro trends point to a consistent gold price increase in line with a larger M2 money supply over the last half century.
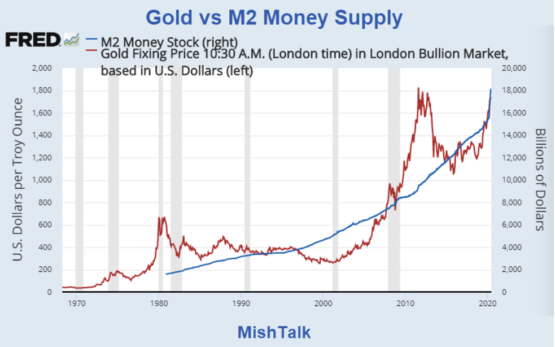
Aside from certain years where sharp declines in gold price seem to correlate negatively with money supply such as in the early 1980s and mid 2010s, the price of gold remains higher than it was in the early 1980s, alongside money supply which sees a larger supply since the same time frame. A point of contention that remains is the difference in volatility, with M2 money supply on a much smoother growth trend than the relatively more volatile changes in gold price.
However, even without these exceptions, this type of short-sighted analysis ignores the larger context in gold price trends and M2 money supply fluctuations. Specifically, it ignores gold price in relation to the rate of change in M2 money supply. In fact, when taking this metric into account, the correlation can only be roughly seen from 2010 onward, with previous years showing the complete opposite.

When comparing gold to the rate of change of M2 money supply versus the supply itself, any strong indication of correlation falls by the wayside. Playing favorites to one time frame over the other by saying that the correlation seems to roughly exist from 2010 onward is analytically irresponsible, ignoring the historical trends which point to no correlation between the two factors. Therefore the question remains, if not M2 money supply, can another indicator be used to track gold prices?
Perhaps investor behavior surrounding gold futures can help explain a correlation between itself and gold price predictions.
Investor Behavior

Commercial contract holders are the producers which sell their gold, with speculators being the ones hedging their positions with contracts. Looking at the side-by-side three-month comparison for gold futures above, it is evident that gold prices rose from $1,579.8 to $1,732.7. However, the amount of contracts both commercial (COTLC (C)) and speculating (COTLC (L)) trading gold decreased significantly, suggesting that these holders had dumped their positions in this given time period. Should selling contracts have been the sole indicator of gold price direction, gold would have cheapened instead of becoming more expensive during this time frame.
Perhaps fabrication demand in industries like jewelry can help explain fluctuations in gold value and gold price predictions.
Fabrication Demand

The World Gold Council reported a 6% decrease in gold demand to a total of 2,107 tons in 2019. Viewing the trend in gold prices during this same time period shows a price increase of 2.7%, an observation that counters the argument that as demand decreases, so should price. However, it does not necessarily have to suggest that demand is not correlated with price. Instead, it suggests that fabrication demand is lesser in importance as a source of demand than an alternative source. In fact, with a total gold supply of about 200,000 tons (with more being produced each year), let’s assume that jewelry demand for gold is 1,000 tons. Assuming 20,000 tons of gold lost, 1,000 / 200,000 = 0.005 change in demand, a minuscule change. If fabrication demand is not of utmost importance, then what is?
Perhaps inflation or interest rates can help explain how people act in accordance with trading gold and setting gold price predictions.
Inflation and Interest Rates
It is said that gold, similar to being a hedge against windy market days is also a good hedge against inflation. Since in recent years gold price has been on the rise, it must be that the market is slowly adopting the view that inflation will be on the rise. And yet, the Coronavirus pandemic has seen inflation rates fall, with some worrying that deflation could be a serious concern for 2021. As unemployment rises, it offsets the demand counterpoised against supply decrease with industries slowing down due to the virus. What else could explain gold price increase if inflation is seemingly a temporary non-determinant?

Analyzing the last decade, there is a visible correlation between gold and interest rates, albeit negative. If gold price and real yield on interest rates is adjusted for inflation, the change in both mirrors the opposite of the another. Coming out of the 2008 Recession, interest rates dropped drastically following 2010, leading to a steady increase in gold price for the same time period. For most of the decade both interest rates and gold price remained fairly modest in fluctuation, barring a drop in gold price mid-decade following a sharp interest rate hike. Yet in recent years, interest rate slashing forced gold to become more expensive. So, why does this correlation exist? Well, since gold pays no interest, it is a bad alternative to holding an asset like a bond if interest rates are high. With deflation an honest concern due to Coronavirus halting industries and causing unemployment, the Fed is likely to down interest rates to fight deflation, which in turn will drive up gold price. This marks a remarkable discovery, it very well be that indirectly, deflation and not inflation, is driving gold price.
For more context we will have to look at a larger time frame and try to pick up on patterns in gold price predictions.
Patterns and Macro Trends

Looking at the graph of historical gold prices from 1920 to 2020, three visible peaks can be seen. One following the end of the 1920’s, another starting in the late 1960’s and continuing into the early 1970s, and another starting from around the year 2000 and through the end of that decade. These three time frames have similar circumstances, all in the form of economic recessions; The Great Depression, the recessions of the late 60s and Oil Crisis of 1973, and the Great Recession of recent memory. Although not conclusive, this may suggest a common held belief that gold is a risk mitigation asset for volatile economic times, such as recessions. In other words, gold could be correlated with the public opinion on institutional ability to keep the economy afloat, such as central banks. To test this hypothesis, one can take a look at the time frame from 1970 onward.
Test Hypothesis with Faith in Banks

Studying a few of the key events in this timeline, one can begin to understand how gold can be correlated to public opinion of financial institutions. In the early 1980s, the Fed raised interest rates to a peak of 20% in June of 1981. Giving the impression of Fed competency in controlling the economy, demand for gold, an asset meant to mitigate market risk, decreased further dropping its price. A 2012 speech by European Central Bank (ECB) president Mario Draghi promised to fix the Euro. Regardless of the endeavor’s degree of success, it shifted public opinion to have faith in the ECB, dropping demand and prices for gold. On December 17, 2015, the public’s faith in the central bank reaches a high point, marking the trend of increased gold prices as talks of ‘normalization’ make that same faith fade away.
Gold Price Elasticity
One thing to note is that historically, gold has had positive price elasticity. This means that gold price is often influenced by supply and demand. As people begin to buy gold because of worsening faith in the market, gold price will rise due to increased demand. This works in tandem with the behavior of central banks. If a central bank has strong foreign exchange reserves and the economy is doing well, they usually try to dump their gold assets which on their own offer little to no return, unlike bonds or other investments. Yet as mentioned before, this is the exact time when investors are not interested in gold, due to a (seemingly) booming economy. This inability to sell the gold further drives the decrease in gold price as observed in the graphs shown previously. The contracts dumping from earlier in the article now suggest another factor which could have offset the shorts’ effect on gold price. Perhaps a bigger trend in investor behavior countered the contract selling, showing long-term gold price increase versus at most a small decrease in gold in the short-term.
Now there is indication of a relationship between gold and faith in central banking institutions, both when public opinion of them is favorable and when the economy is not doing so well. This monetary demand correlation with gold is explainable as the ‘degree of reluctance of the current owners of gold to part with their gold at current prices’ (Pater Tenebrarum). And as such, gold finds itself commonly negatively correlated with the market, helping investors smooth out periods of volatility and unforeseen risks.
With such conclusions reached, does one have to wait for a recession to buy gold? Absolutely not! Gold price predictions have never been easier than they are now, with the I Know First predictive algorithm.
Gold Price Predictions with I Know First Algorithm

The I Know First self-learning algorithm analyzes, models, and predicts the stock market. The algorithm is based on Artificial Intelligence (AI) and Machine Learning (ML) and incorporates elements of Artificial Neural Networks and Genetic Algorithms.
The system outputs the predicted trend as a number, positive or negative, along with a wave chart that predicts how the waves will overlap the trend. This helps the trader to decide which direction to trade, at what point to enter the trade, and when to exit. Since the model is 100% empirical, the results are based only on factual data, thereby avoiding any biases or emotions that may accompany human derived assumptions.
The human factor is only involved in building the mathematical framework and providing the initial set of inputs and outputs to the system. The algorithm produces a forecast with a signal and a predictability indicator. The signal is the number in the middle of the box. The predictability is the number at the bottom of the box. At the top, a specific asset is identified. This format is consistent across all predictions.
Our algorithm provides two independent indicators for each asset – Signal and Predictability.
The Signal is the predicted strength and direction of the movement of the asset. Measured from -inf to +inf.
The predictability indicates our confidence in that result. It is a Pearson correlation coefficient between past algorithmic performance and actual market movement. Measured from -1 to 1.
You can find a detailed description of our heatmap here.
Returns on gold up to 29.48% in the last year remain strong, and here at I Know First, our algorithm has modeled and predicted assets price movement worldwide for short-term and long-term time horizons, ranging from 3 days to a year. Since 2011, we have been providing not only gold price predictions, but also daily predictions for more than 10,500 assets, including forex forecast, bitcoin forecast, world indices and for individual stocks. Additionally, we provide special coverage for the latest Apple stock news. Our forecasts generated by our algorithmic trading tool is used by institutional clients, as well as private investors and traders to identify the top assets to buy in the market and exercise the trade faster than the other market players.

To subscribe today click here.
Please note-for trading decisions use the most recent forecast.


