
Hong Kong Stocks Based on Stock Prediction Algorithm: Returns up to 134.29% in 1 Year
Hong Kong Stocks
This forecast is part of the By Country Package, as one of I Know First’s algorithmic trading tools. The full forecast includes daily predictions for a total of 20 Hong Kong stocks with bullish and bearish signals:
- Top 10 Hong Kong stocks for the long position
- Top 10 Hong Kong stocks for the short position
Package Name: By Country – Hong Kong Stocks
Recommended Positions: Long
Forecast Length: 1 Year (1/15/2019 – 1/15/2020)
I Know First Average: 45.68%
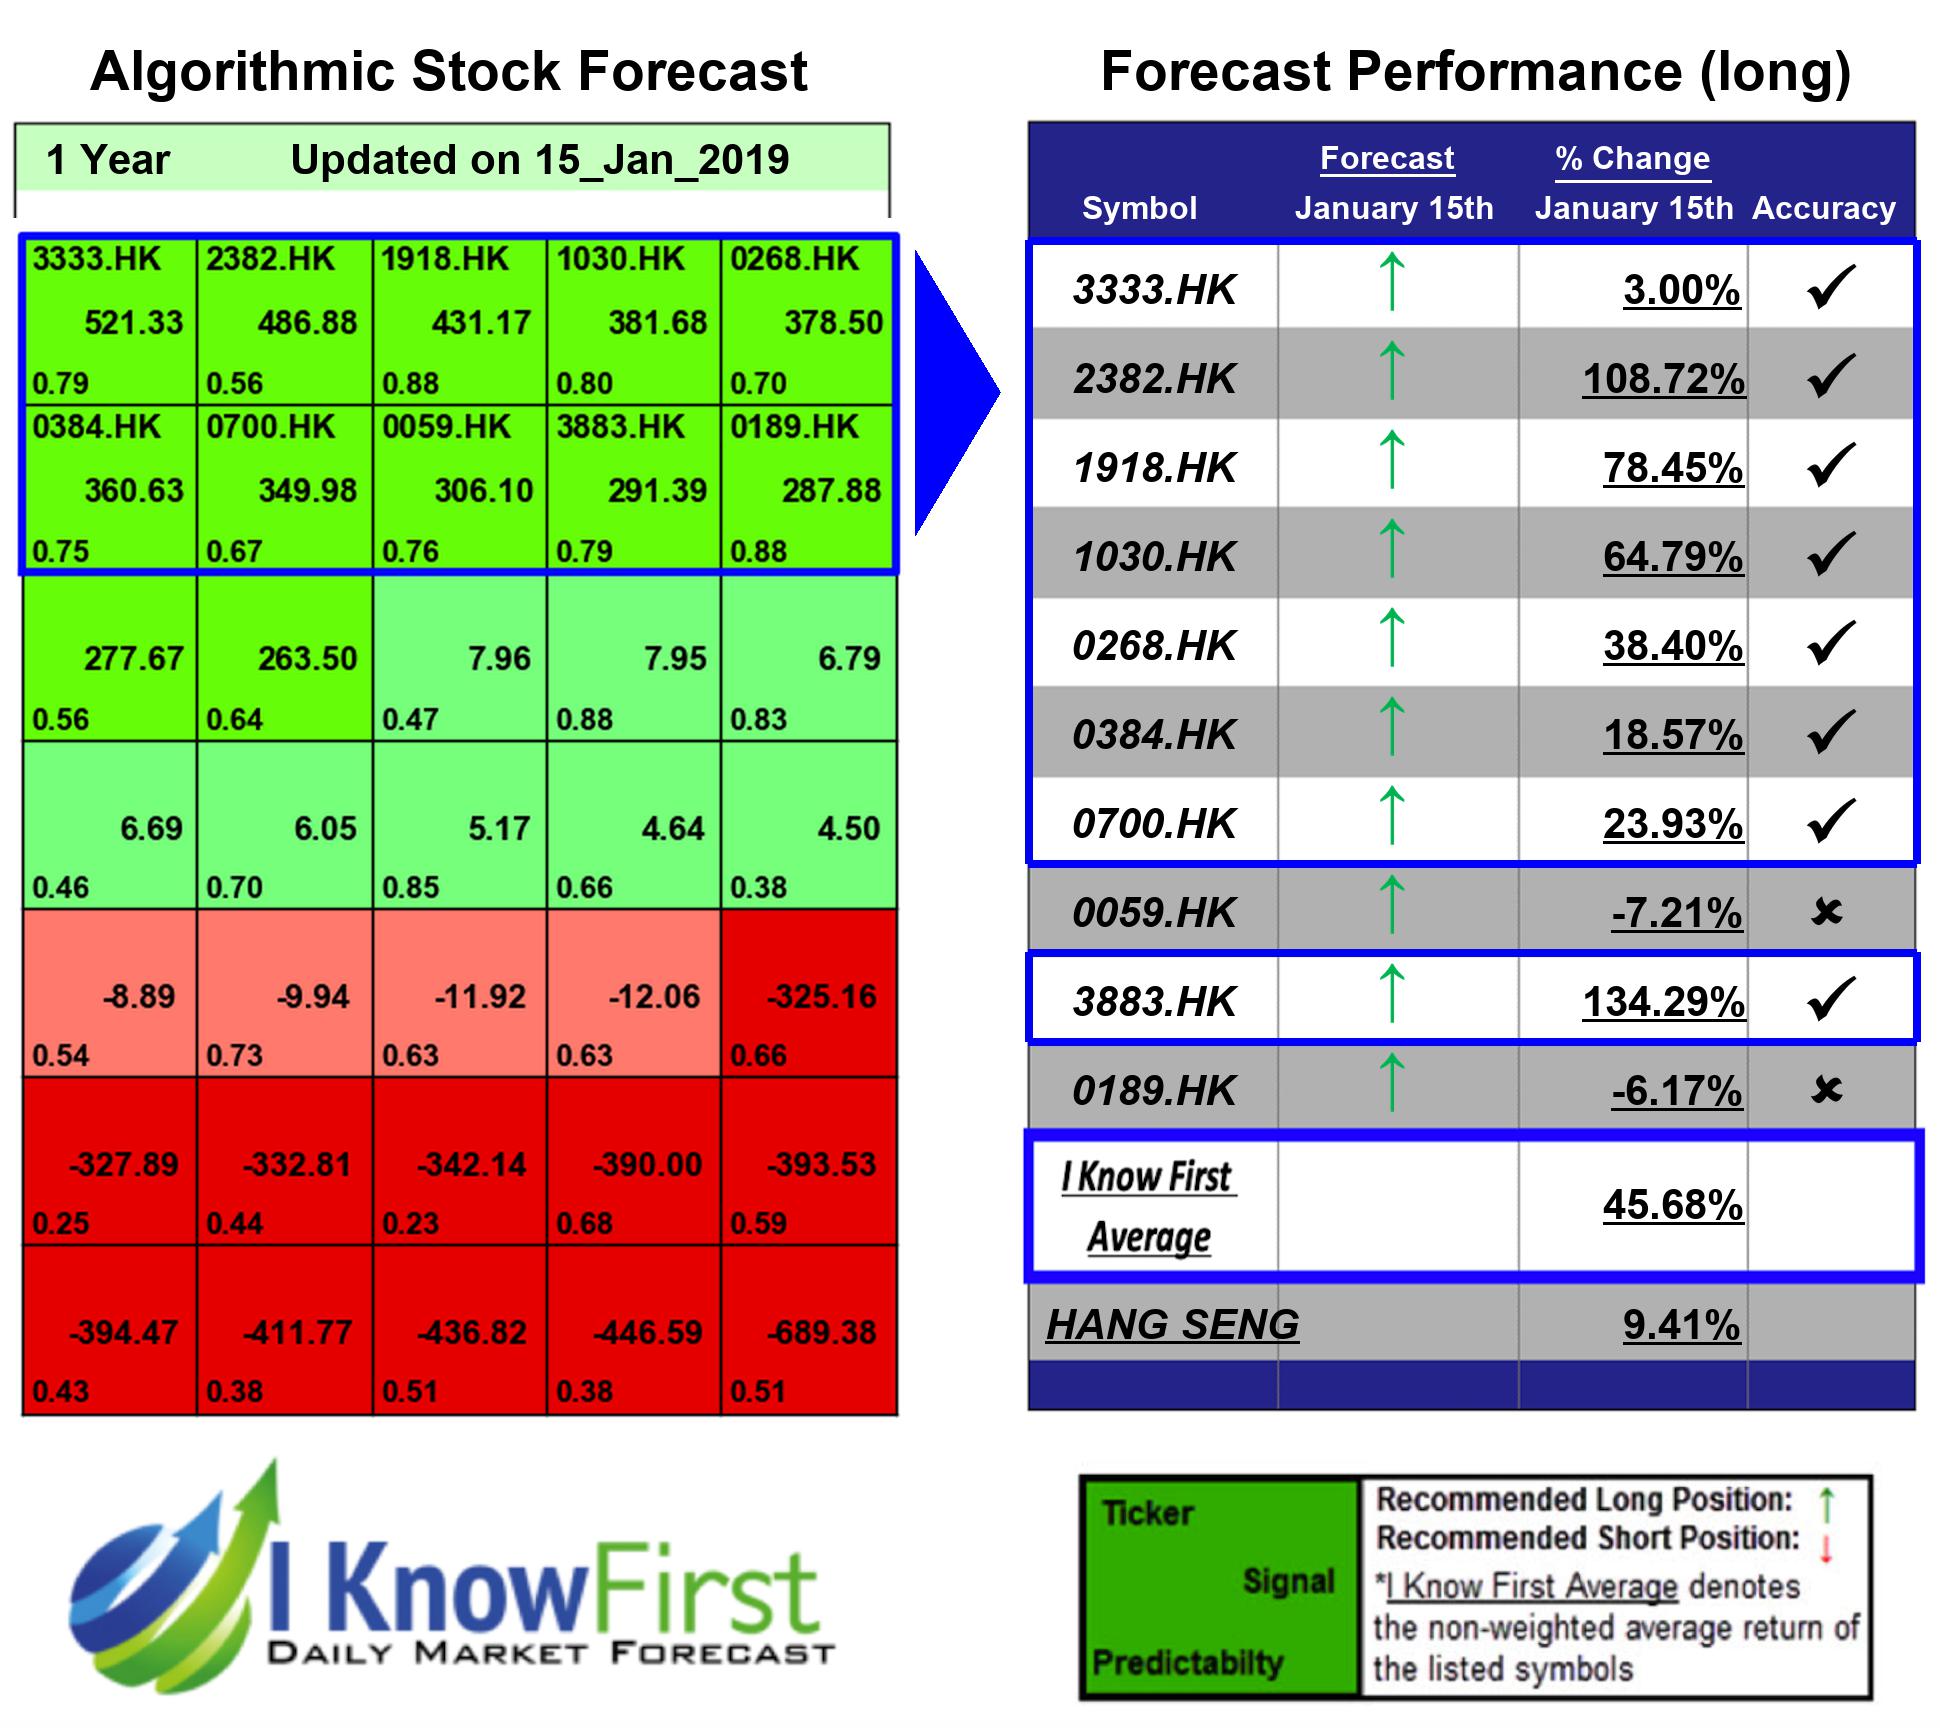
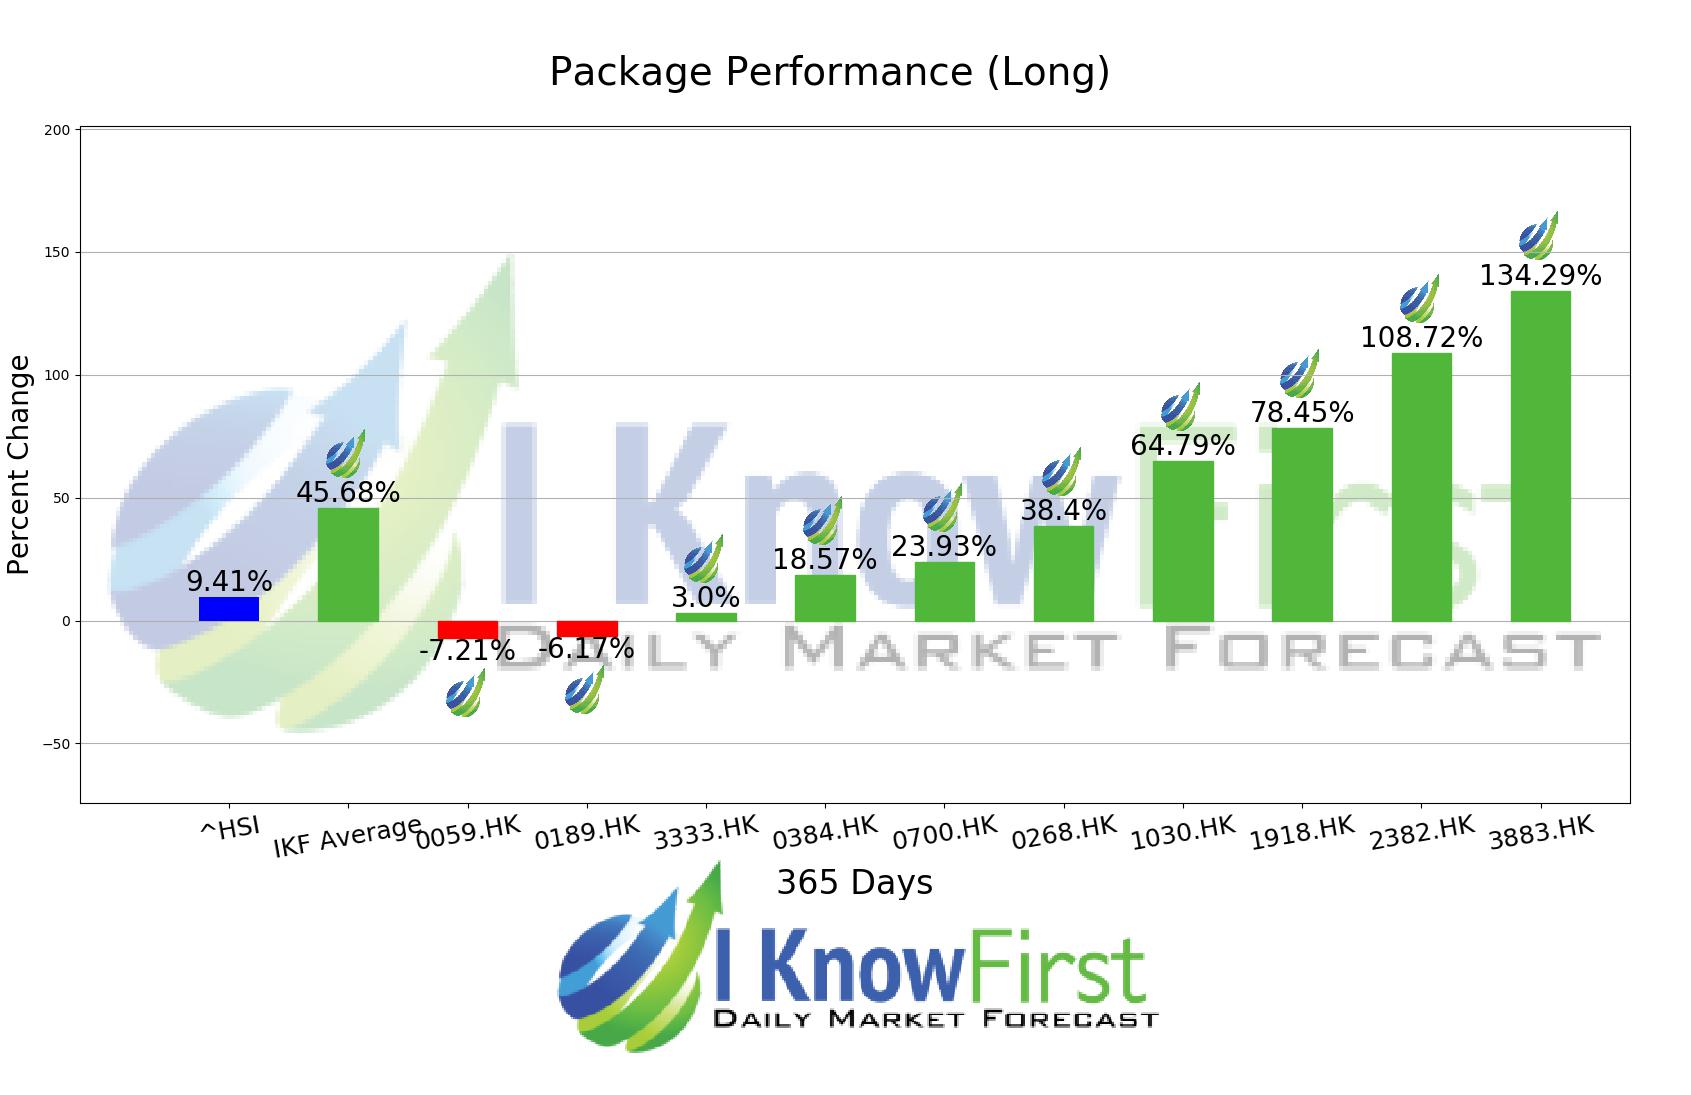
Several predictions in this 1 Year forecast saw significant returns. The algorithm had correctly predicted 8 out 10 stock movements. The highest trade return came from 3883.HK, at 134.29%. 2382.HK and 1918.HK also performed well for this time horizon with returns of 108.72% and 78.45%, respectively. The package had an overall average return of 45.68%, providing investors with a 36.27% premium over the HANG SENG’s return of 9.41% during the period.
China Aoyuan Group Limited, formerly China Aoyuan Property Group Limited, is an investment holding company principally engaged in the sales of properties. The Company operates its business through three segments. The Property Development segment is engaged in the development and sale of properties. The Property Investment segment is engaged in the leasing of investment properties. The Others segment is engaged in hotel operation, the provision of consulting and management services. Through its subsidiaries, the Company is also engaged in construction business.
Algorithmic traders utilize these daily forecasts by the I Know First market prediction system as a tool to enhance portfolio performance, verify their own analysis and act on market opportunities faster. This forecast was sent to current I Know First subscribers.
How to interpret this diagram
Algorithmic Stock Forecast: The table on the left is a stock forecast produced by I Know First’s algorithm. Each day, subscribers receive forecasts for six different time horizons. Note that the top 10 stocks in the 1-month forecast may be different than those in the 1-year forecast. In the included table, only the relevant stocks have been included. The boxes are arranged according to their respective signal and predictability values (see below for detailed definitions). A green box represents a positive forecast, suggesting a long position, while a red represents a negative forecast, suggesting a short position.
Please note-for trading decisions use the most recent forecast. Get today’s forecast and Top stock picks.


