
Hong Kong Stocks Based on Machine Learning: Returns up to 7.84% in 7 Days
Hong Kong Stocks
This forecast is part of the By Country Package, as one of I Know First’s algorithmic trading tools. The full forecast includes daily predictions for a total of 20 Hong Kong stocks with bullish and bearish signals:
- Top 10 Hong Kong stocks for the long position
- Top 10 Hong Kong stocks for the short position
Package Name: By Country – Hong Kong Stocks
Recommended Positions: Long
Forecast Length: 7 Days (3/1/2020 – 3/8/2020)
I Know First Average: 1.96%

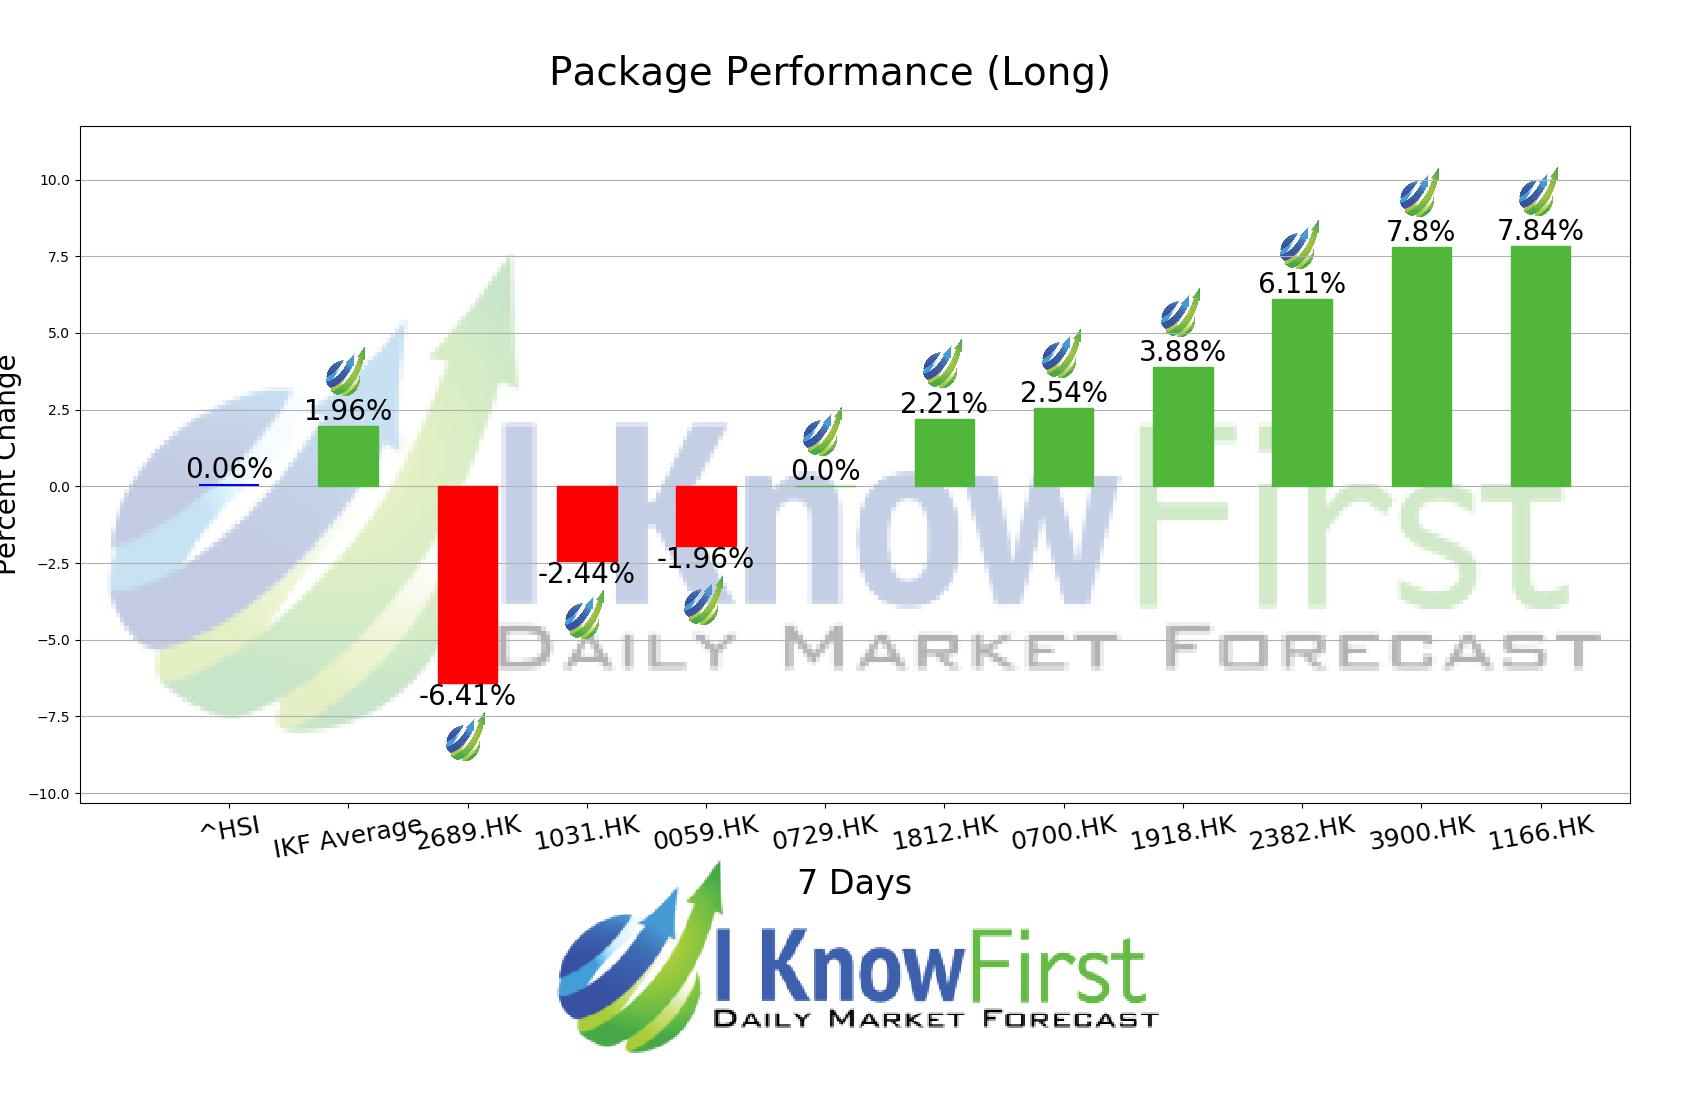
For this 7 Days forecast the algorithm had successfully predicted 6 out of 10 movements. The greatest return came from 1166.HK at 7.84%. Additional high returns came from 3900.HK and 2382.HK, at 7.8% and 6.11% respectively. The package had an overall average return of 1.96%, providing investors with a 1.90% premium over the HANG SENG’s return of 0.06% during the period.
Solartech International Holdings Limited is an investment holding company principally engaged in the industrial components and equipment business. The Company operates through four business segments: manufacture and trading of cables and wires segment, manufacture and trading of copper rods segment, trading of metallurgical grade bauxite segment and investment properties segment. The Company is also involved in the assets evaluation, the holding of mining and exploration rights, as well as the production of renewable biodiesel by utilizing molecular distillation technologies through its subsidiaries.
Algorithmic traders utilize these daily forecasts by the I Know First market prediction system as a tool to enhance portfolio performance, verify their own analysis and act on market opportunities faster. This forecast was sent to current I Know First subscribers.
How to interpret this diagram
Algorithmic Stock Forecast: The table on the left is a stock forecast produced by I Know First’s algorithm. Each day, subscribers receive forecasts for six different time horizons. Note that the top 10 stocks in the 1-month forecast may be different than those in the 1-year forecast. In the included table, only the relevant stocks have been included. The boxes are arranged according to their respective signal and predictability values (see below for detailed definitions). A green box represents a positive forecast, suggesting a long position, while a red represents a negative forecast, suggesting a short position.
Please note-for trading decisions use the most recent forecast. Get today’s forecast and Top stock picks.


