Home Builders Stocks Based on Pattern Recognition: Returns up to 52.65% in 1 Year
Home Builders Stocks
This Home Builders Stocks Package is designed for investors and analysts who need predictions of the best performing stocks for the whole Home Builders sector. It includes 20 stocks with bullish and bearish signals and indicates the best Home Builders stocks to buy:
- Top 10 Home Builders stocks for the long position
- Top 10 Home Builders stocks for the short position
Package Name: Home Builders
Recommended Positions: Long
Forecast Length: 1 Year (2/26/2019 – 2/26/2020)
I Know First Average: 32.47%

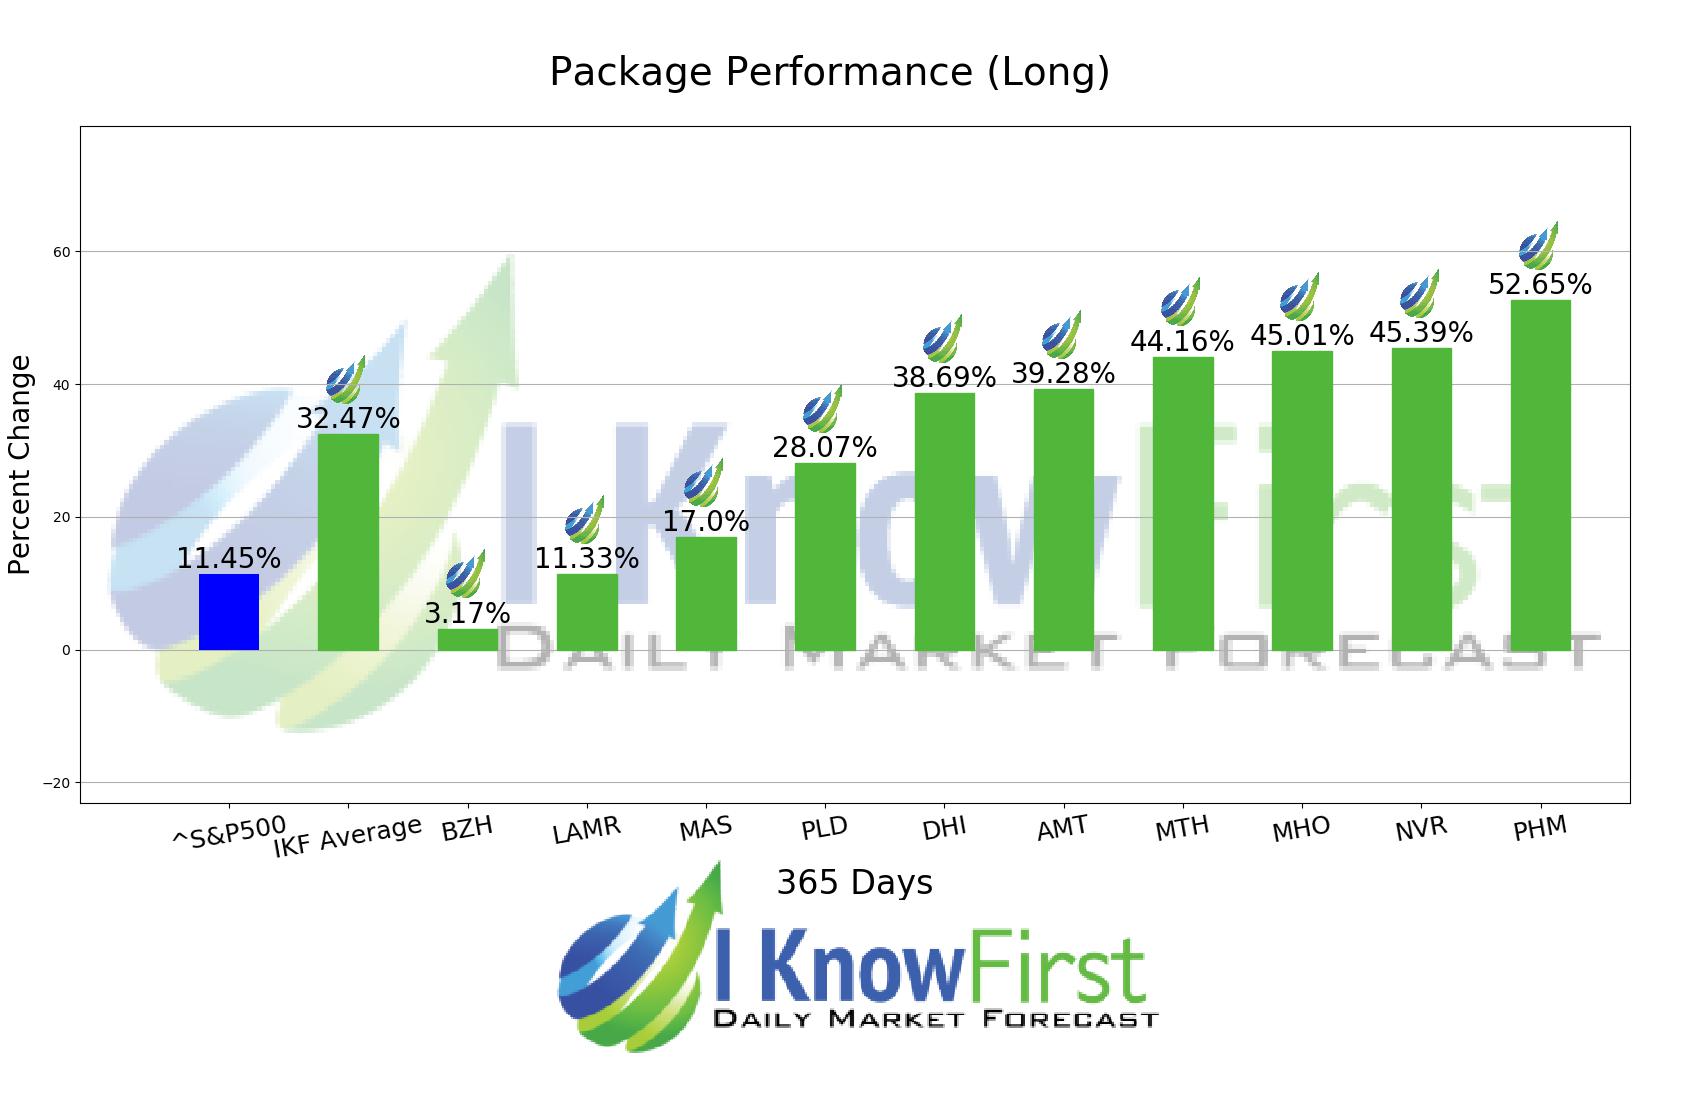
For this 1 Year forecast the algorithm had successfully predicted 10 out of 10 movements. PHM was our best stock pick this week a return of 52.65%. Further notable returns came from NVR and MHO at 45.39% and 45.01%, respectively. The Home Builders package had an overall average return of 32.47%, providing investors with a premium of 21.02% over the S&P 500’s return of 11.45%.
PulteGroup, Inc. (PHM), through its subsidiaries, engages primarily in the homebuilding business in the United States. The company is involved in the acquisition and development of land primarily for residential purposes; and the construction of housing on such land. It offers various home designs, including single-family detached, townhouses, condominiums, and duplexes under the Centex, Pulte Homes, Del Webb, DiVosta Homes John Wieland Homes, and Neighborhoods names. As of March 31, 2016, the company controlled 102,580 owned lots and 43,072 lots under land option agreements. It also arranges financing through the origination of mortgage loans, principally for homebuyers; sells the servicing rights for the originated loans; and provides title insurance policies, and examination and closing services to homebuyers. The company was formerly known as Pulte Homes, Inc. and changed its name to PulteGroup, Inc. (PHM) in March 2010. PulteGroup, Inc. (PHM) was founded in 1950 and is headquartered in Atlanta, Georgia.
Algorithmic traders utilize these daily forecasts by the I Know First market prediction system as a tool to enhance portfolio performance, verify their own analysis and act on market opportunities faster. This forecast was sent to current I Know First subscribers.
How to interpret this diagram
Algorithmic Stock Forecast: The table on the left is a stock forecast produced by I Know First’s algorithm. Each day, subscribers receive forecasts for six different time horizons. Note that the top 10 stocks in the 1-month forecast may be different than those in the 1-year forecast. In the included table, only the relevant stocks have been included. The boxes are arranged according to their respective signal and predictability values (see below for detailed definitions). A green box represents a positive forecast, suggesting a long position, while a red represents a negative forecast, suggesting a short position.
Please note-for trading decisions use the most recent forecast. Get today’s forecast and Top stock picks.