Home Builders Stocks Based on Genetic Algorithms: Returns up to 114.56% in 14 Days
Home Builders Stocks
This Home Builders Stocks Package is designed for investors and analysts who need predictions of the best performing stocks for the whole Home Builders sector. It includes 20 stocks with bullish and bearish signals and indicates the best Home Builders stocks to buy:
- Top 10 Home Builders stocks for the long position
- Top 10 Home Builders stocks for the short position
Package Name: Home Builders
Recommended Positions: Long
Forecast Length: 14 Days (1/8/21 – 1/23/21)
I Know First Average: 18.83%
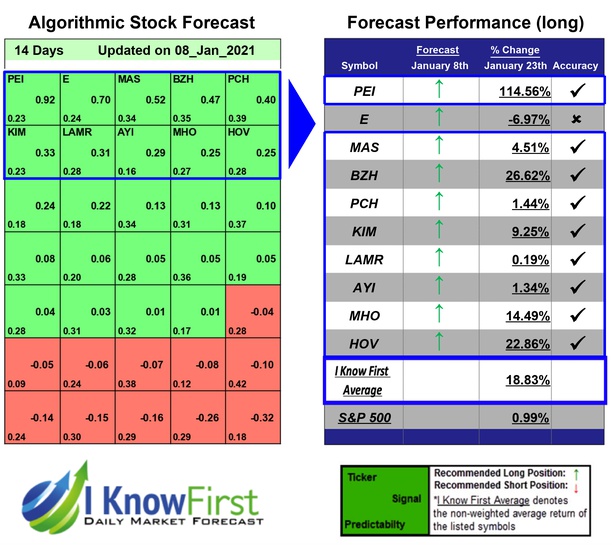

In this 14 Days forecast for the Home Builders Package, there were many high performing trades and the algorithm correctly predicted 9 out 10 trades. The prediction with the highest return was PEI, at 114.56%. Other notable stocks were BZH and HOV with a return of 26.62% and 22.86%. The package had an overall average return of 18.83%, providing investors with a 17.84% premium over the S&P 500’s return of 0.99% during the period.
Pennsylvania Real Estate Investment Trust (PEI) (PREIT) is a publicly owned equity real estate investment trust. The firm manages owns, manages, develops, acquires, and leases mall and power and strip centers primarily in the Eastern United States. It also provides management, leasing, and development services to affiliate and third party property owners. Pennsylvania Real Estate Investment Trust (PEI) was founded in 1960 and is based in Philadelphia, Pennsylvania.
Algorithmic traders utilize these daily forecasts by the I Know First market prediction system as a tool to enhance portfolio performance, verify their own analysis and act on market opportunities faster. This forecast was sent to current I Know First subscribers.
How to interpret this diagram
Algorithmic Stock Forecast: The table on the left is a stock forecast produced by I Know First’s algorithm. Each day, subscribers receive forecasts for six different time horizons. Note that the top 10 stocks in the 1-month forecast may be different than those in the 1-year forecast. In the included table, only the relevant stocks have been included. The boxes are arranged according to their respective signal and predictability values (see below for detailed definitions). A green box represents a positive forecast, suggesting a long position, while a red represents a negative forecast, suggesting a short position.
Please note-for trading decisions use the most recent forecast. Get today’s forecast and Top stock picks.