Home Builders Stocks Based on Algo Trading: Returns up to 10.19% in 7 Days
Home Builders Stocks
This Home Builders Stocks Package is designed for investors and analysts who need predictions of the best performing stocks for the whole Home Builders sector. It includes 20 stocks with bullish and bearish signals and indicates the best Home Builders stocks to buy:
- Top 10 Home Builders stocks for the long position
- Top 10 Home Builders stocks for the short position
Package Name: Home Builders
Recommended Positions: Long
Forecast Length: 7 Days (7/14/2020 – 7/21/2020)
I Know First Average: 4.11%

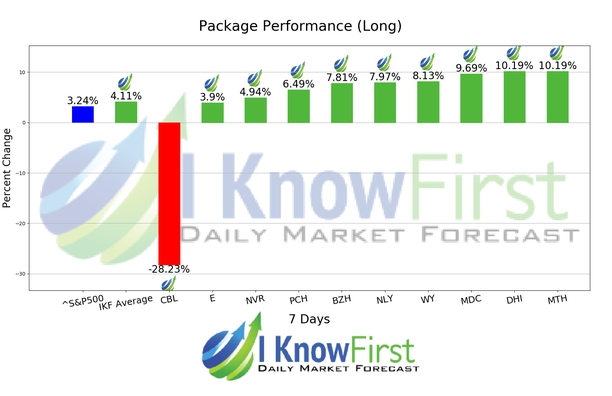
During the 7 Days forecasted period several picks in the Home Builders Package saw significant returns. The algorithm had correctly predicted 9 out 10 returns. The top performing prediction from this package was DHI with a return of 10.19%. MTH and MDC also performed well for this time horizon with returns of 10.19% and 9.69%, respectively. The package’s overall average return was 4.11%, providing investors with a 0.87% premium over the S&P 500’s return of 3.24% during the same period.
D.R. Horton, Inc. (DHI) operates as a homebuilding company. It engages in the acquisition and development of land; and construction and sale of homes in 27 states and 79 markets in the United States under the names of D.R. Horton, America’s Builder, Express Homes, Emerald Homes, Regent Homes, Crown Communities, and Pacific Ridge Homes. The company constructs and sells single-family detached homes; and attached homes, such as town homes, duplexes, triplexes, and condominiums. It is also involved in the origination and sale of mortgages; and provision of title insurance policies, and examination and closing services. The company primarily serves title insurance agents, homebuyers, and homebuilding customers. D.R. Horton, Inc. (DHI) was founded in 1978 and is headquartered in Fort Worth, Texas.
Algorithmic traders utilize these daily forecasts by the I Know First market prediction system as a tool to enhance portfolio performance, verify their own analysis and act on market opportunities faster. This forecast was sent to current I Know First subscribers.
How to interpret this diagram
Algorithmic Stock Forecast: The table on the left is a stock forecast produced by I Know First’s algorithm. Each day, subscribers receive forecasts for six different time horizons. Note that the top 10 stocks in the 1-month forecast may be different than those in the 1-year forecast. In the included table, only the relevant stocks have been included. The boxes are arranged according to their respective signal and predictability values (see below for detailed definitions). A green box represents a positive forecast, suggesting a long position, while a red represents a negative forecast, suggesting a short position.
Please note-for trading decisions use the most recent forecast. Get today’s forecast and Top stock picks.