
High Volume Stocks Based on Pattern Recognition: Returns up to 25.49% in 1 Month
High Volume Stocks
The High Volume Low Price Stocks Package is designed for investors and analysts who need predictions for stocks currently trading between $5 and $10, and with an average daily trading volume above one million dollars. It includes 20 stocks with bullish and bearish signals and indicates the best shares to buy and sell:
- Low Price High Volume Stocks Top 10 stocks for the long position
- Low Price High Volume Stocks Top 10 stocks for the short position

Package Name: Low Price High Volume Stocks
Recommended Positions: Long
Forecast Length: 1 Month (11/24/2019 – 12/25/2019)
I Know First Average: 10.28%
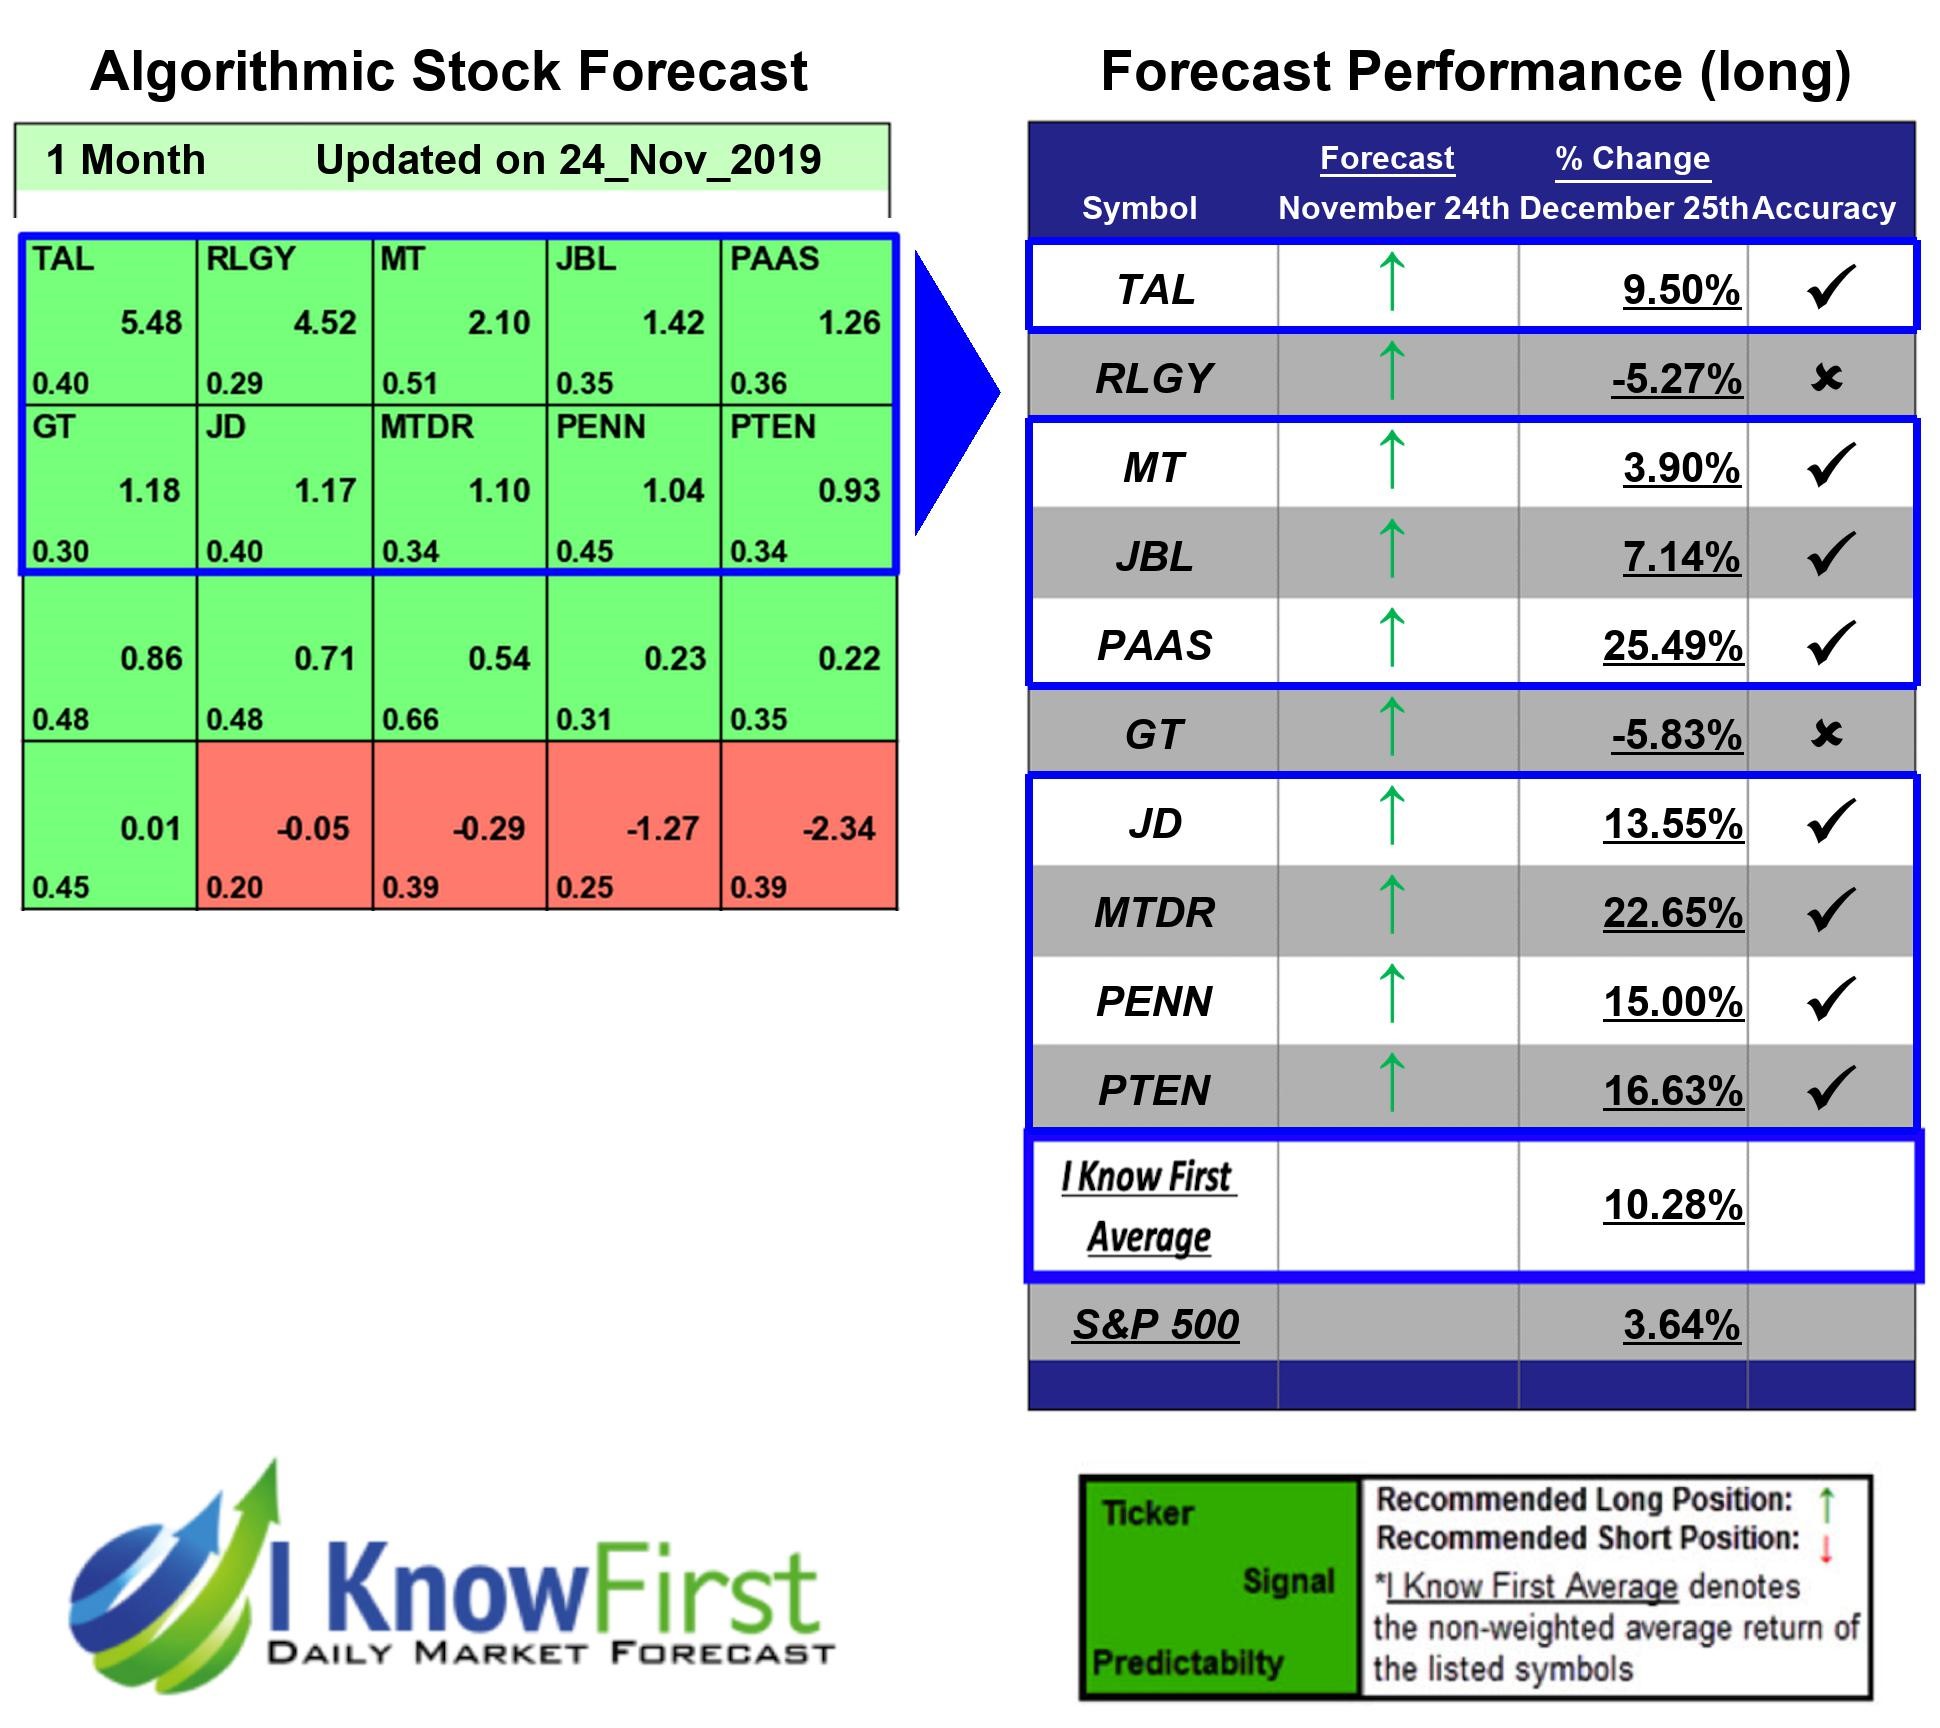
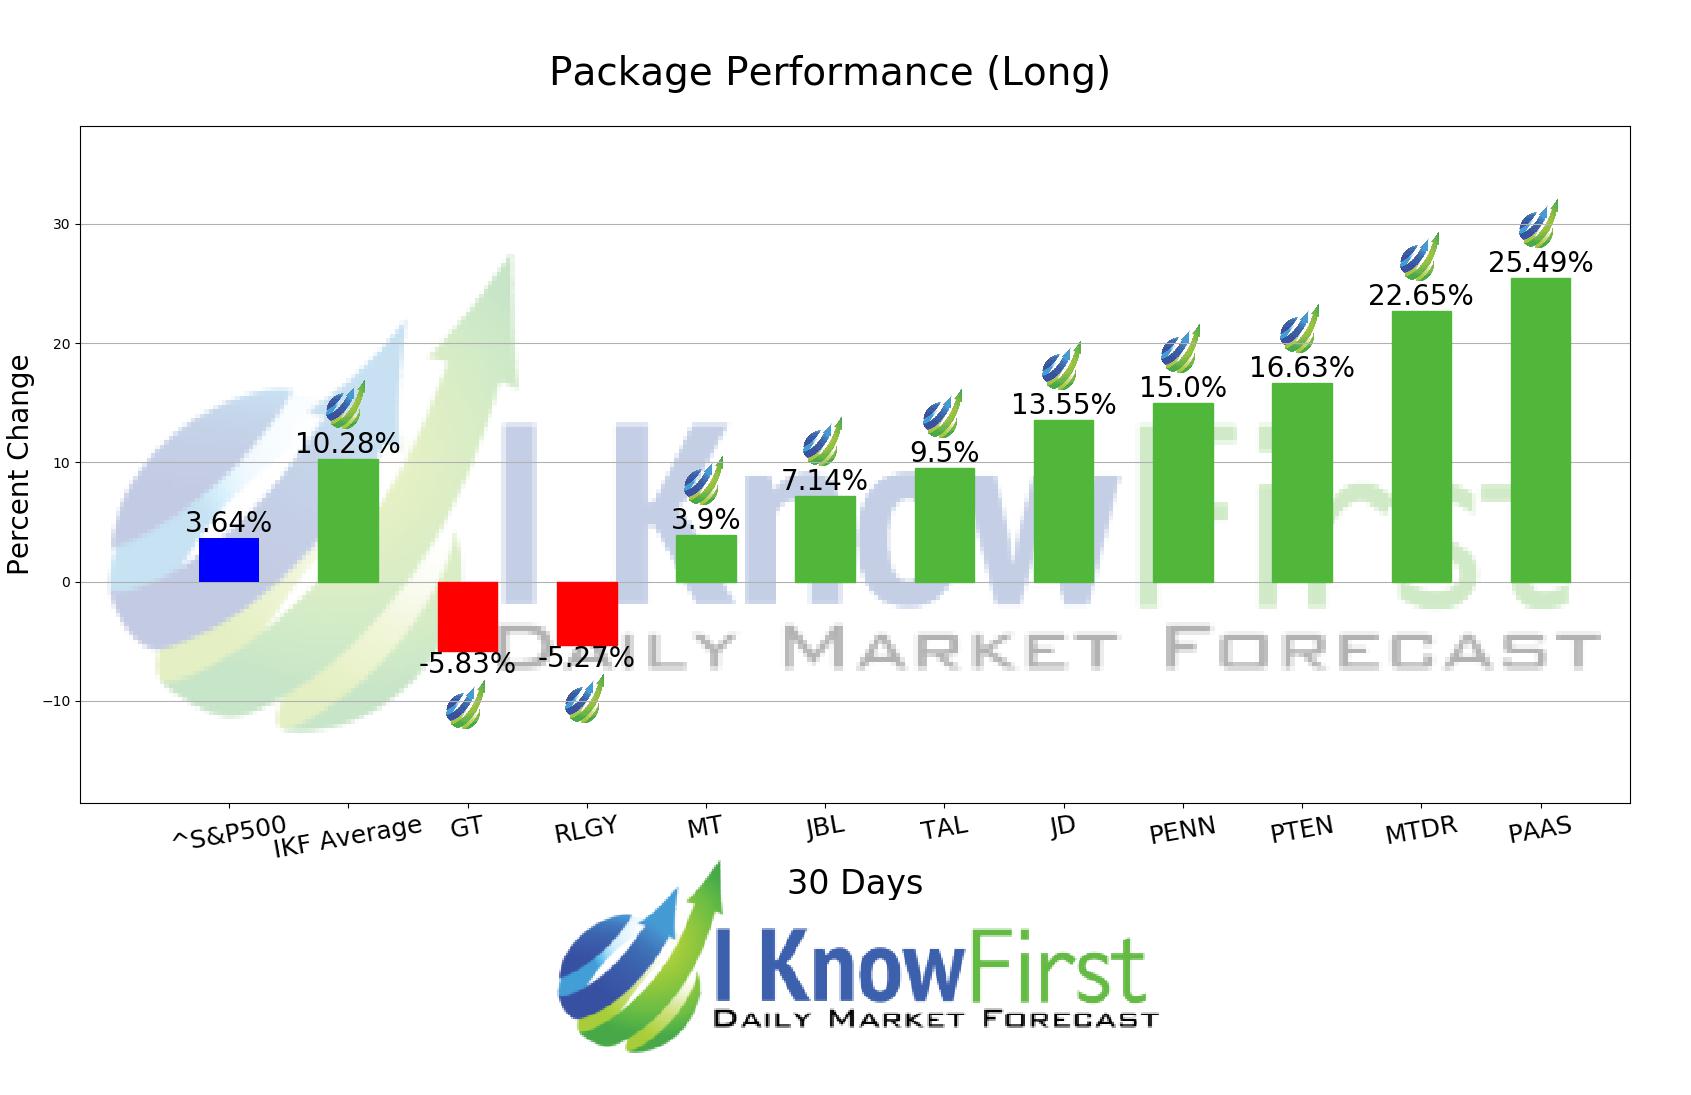
I Know First’s State of the Art Algorithm accurately forecasted 8 out of 10 trades in this Low Price High Volume Stocks Package for the 1 Month time period. PAAS was the top performing prediction with a return of 25.49%. Further notable returns came from MTDR and PTEN at 22.65% and 16.63%, respectively. The Low Price High Volume Stocks package had an overall average return of 10.28%, providing investors with a premium of 6.64% over the S&P 500’s return of 3.64%.
Pan American Silver Corp. (PAAS), together with its subsidiaries, engages in silver mining and related activities. Its activities include the exploration, mine development, extraction, processing, refining, and reclamation of silver mines.
Algorithmic traders utilize these daily forecasts by the I Know First market prediction system as a tool to enhance portfolio performance, verify their own analysis and act on market opportunities faster. This forecast was sent to current I Know First subscribers.
How to interpret this diagram
Algorithmic Stock Forecast: The table on the left is a stock forecast produced by I Know First’s algorithm. Each day, subscribers receive forecasts for six different time horizons. Note that the top 10 stocks in the 1-month forecast may be different than those in the 1-year forecast. In the included table, only the relevant stocks have been included. The boxes are arranged according to their respective signal and predictability values (see below for detailed definitions). A green box represents a positive forecast, suggesting a long position, while a red represents a negative forecast, suggesting a short position.
Please note-for trading decisions use the most recent forecast. Get today’s forecast and Top stock picks.


