
High Volume Stocks Based on Big Data Analytics: Returns up to 16.11% in 14 Days
High Volume Stocks
The High Volume Low Price Stocks Package is designed for investors and analysts who need predictions for stocks currently trading between $5 and $10, and with an average daily trading volume above one million dollars. It includes 20 stocks with bullish and bearish signals and indicates the best shares to buy and sell:
- Low Price High Volume Stocks Top 10 stocks for the long position
- Low Price High Volume Stocks Top 10 stocks for the short position

Package Name: Low Price High Volume Stocks
Recommended Positions: Long
Forecast Length: 14 Days (3/3/21 – 3/17/21)
I Know First Average: 4.67%
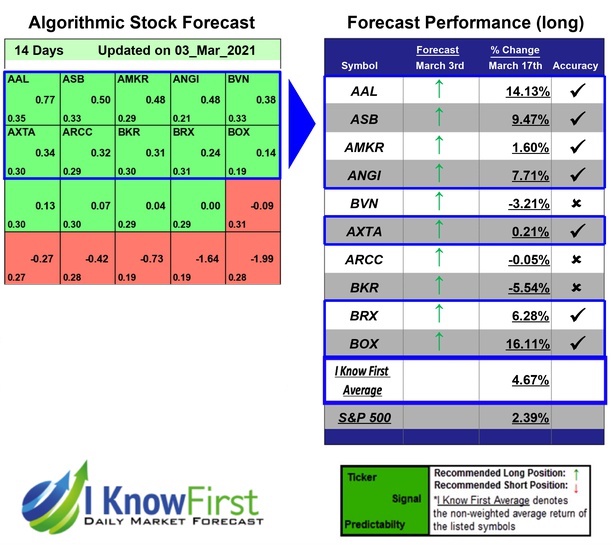

The algorithm correctly predicted 7 out 10 of the suggested trades in the Low Price High Volume Stocks Package for this 14 Days forecast. BOX was our best stock pick this week a return of 16.11%. AAL and ASB also performed well for this time horizon with returns of 14.13% and 9.47%, respectively. The Low Price High Volume Stocks package had an overall average return of 4.67%, providing investors with a premium of 2.28% over the S&P 500’s return of 2.39%.
Box, Inc. (BOX) provides cloud-based mobile optimized enterprise content collaboration platform that enables organizations of various sizes to manage their enterprise content from anywhere. The company’s platform enables users to collaborate on content internally and with external parties, automate content-driven business processes, develop custom applications, and implement data protection, security, and compliance features. Box, Inc. (BOX) offers its solution in 22 languages. It serves healthcare and life sciences, financial services, legal services, media and entertainment, retail, education, energy, and government industries. The company was formerly known as Box.net, Inc. and changed its name to Box, Inc. (BOX) in November 2011. Box, Inc. was founded in 2005 and is headquartered in Redwood City, California.
Algorithmic traders utilize these daily forecasts by the I Know First market prediction system as a tool to enhance portfolio performance, verify their own analysis and act on market opportunities faster. This forecast was sent to current I Know First subscribers.
How to interpret this diagram
Algorithmic Stock Forecast: The table on the left is a stock forecast produced by I Know First’s algorithm. Each day, subscribers receive forecasts for six different time horizons. Note that the top 10 stocks in the 1-month forecast may be different than those in the 1-year forecast. In the included table, only the relevant stocks have been included. The boxes are arranged according to their respective signal and predictability values (see below for detailed definitions). A green box represents a positive forecast, suggesting a long position, while a red represents a negative forecast, suggesting a short position.
Please note-for trading decisions use the most recent forecast. Get today’s forecast and Top stock picks.


