
High Volume Stocks Based on Algorithmic Trading: Returns up to 37.39% in 1 Month
High Volume Stocks
The High Volume Low Price Stocks Package is designed for investors and analysts who need predictions for stocks currently trading between $5 and $10, and with an average daily trading volume above one million dollars. It includes 20 stocks with bullish and bearish signals and indicates the best shares to buy and sell:
- Low Price High Volume Stocks Top 10 stocks for the long position
- Low Price High Volume Stocks Top 10 stocks for the short position

Package Name: Low Price High Volume Stocks
Recommended Positions: Long
Forecast Length: 1 Month (12/6/2019 – 1/7/2020)
I Know First Average: 13.32%

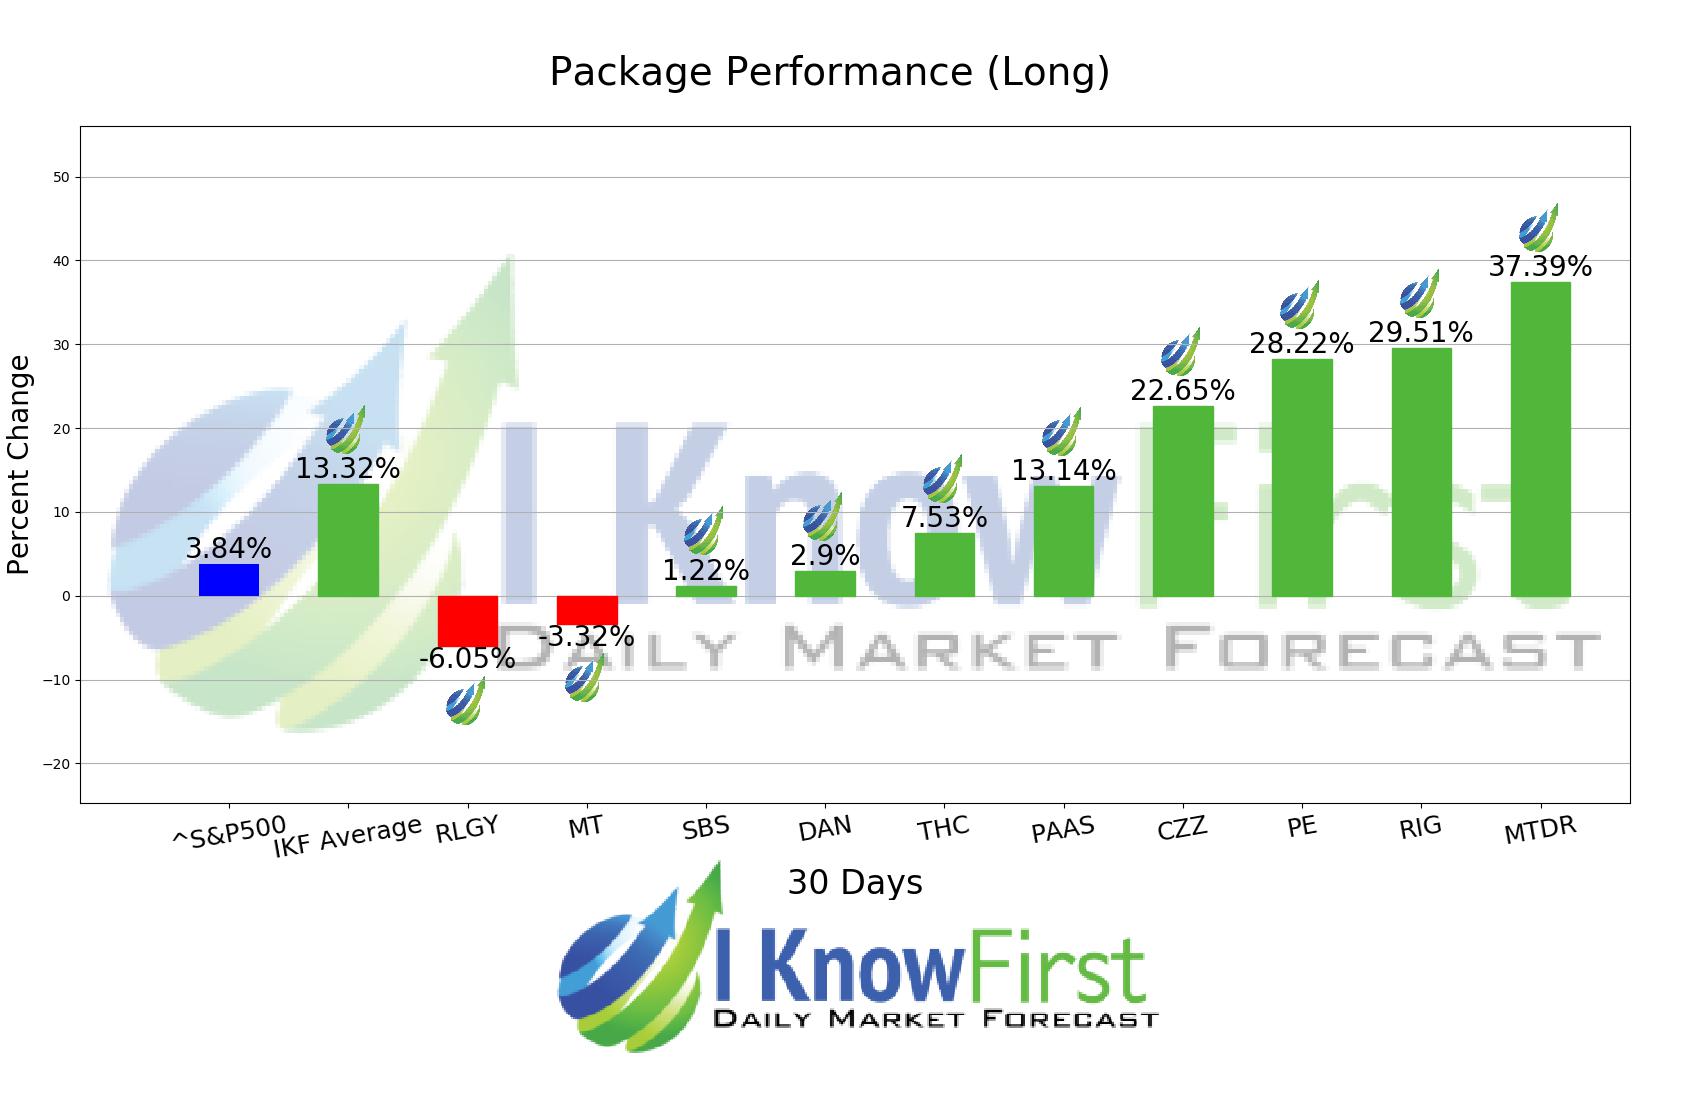
Several predictions in this 1 Month forecast saw significant returns. The algorithm had correctly predicted 8 out 10 stock movements. The top performing prediction from this package was MTDR with a return of 37.39%. RIG and PE followed with returns of 29.51% and 28.22% for the 1 Month period. The package saw an overall yield of 13.32% versus the S&P 500’s return of 3.84% implying a market premium of 9.48%.
Matador Resources Company (MTDR), an independent energy company, engages in the exploration, development, production, and acquisition of oil and natural gas resources in the United States. The company primarily holds interests in the Wolfcamp and Bone Spring plays in the Delaware Basin in Southeast New Mexico and West Texas; the Eagle Ford shale play in South Texas; and the Haynesville shale and Cotton Valley plays in Northwest Louisiana and East Texas. As of December 31, 2015, its estimated proved oil and natural gas reserves were 85.1 million barrels of oil equivalent, including 45.6 million stock tank barrels of oil and 236.9 billion cubic feet of natural gas. The company was formerly known as Matador Holdco, Inc. and changed its name to Matador Resources Company (MTDR) in August 2011. Matador Resources Company (MTDR) was founded in 2003 and is headquartered in Dallas, Texas.
Algorithmic traders utilize these daily forecasts by the I Know First market prediction system as a tool to enhance portfolio performance, verify their own analysis and act on market opportunities faster. This forecast was sent to current I Know First subscribers.
How to interpret this diagram
Algorithmic Stock Forecast: The table on the left is a stock forecast produced by I Know First’s algorithm. Each day, subscribers receive forecasts for six different time horizons. Note that the top 10 stocks in the 1-month forecast may be different than those in the 1-year forecast. In the included table, only the relevant stocks have been included. The boxes are arranged according to their respective signal and predictability values (see below for detailed definitions). A green box represents a positive forecast, suggesting a long position, while a red represents a negative forecast, suggesting a short position.
Please note-for trading decisions use the most recent forecast. Get today’s forecast and Top stock picks.


