
High Volume Low Price Stocks Based on AI: Returns up to 139.65% in 1 Year
High Volume Low Price Stocks
The High Volume Low Price Stocks Package is designed for investors and analysts who need predictions for stocks currently trading between $5 and $10, and with an average daily trading volume above one million dollars. It includes 20 stocks with bullish and bearish signals and indicates the best shares to buy and sell:
- Low Price High Volume Stocks Top 10 stocks for the long position
- Low Price High Volume Stocks Top 10 stocks for the short position

Package Name: Low Price High Volume Stocks
Recommended Positions: Long
Forecast Length: 1 Year (5/19/20 – 5/19/21)
I Know First Average: 86.39%
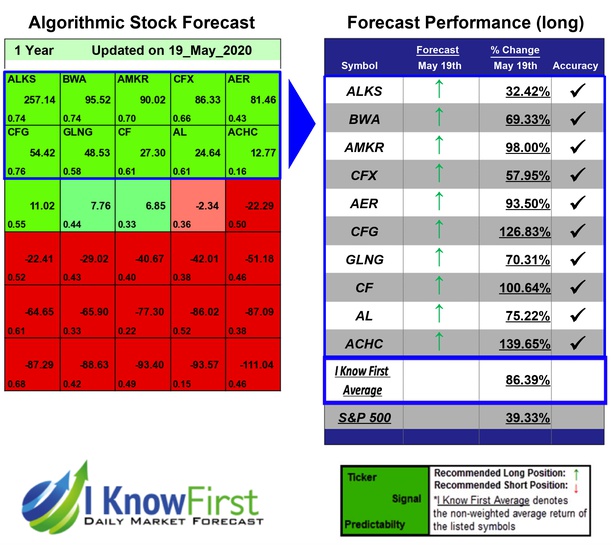
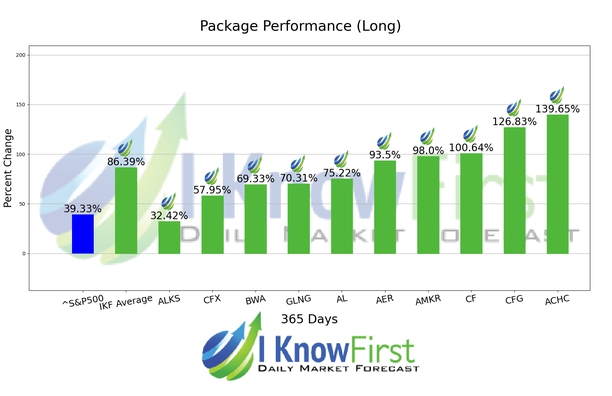
For this 1 Year forecast the algorithm had successfully predicted 10 out of 10 movements. ACHC was the highest-earning trade with a return of 139.65% in 1 Year. Further notable returns came from CFG and CF at 126.83% and 100.64%, respectively. The Low Price High Volume Stocks package had an overall average return of 86.39%, providing investors with a premium of 47.06% over the S&P 500’s return of 39.33%.
Acadia Healthcare Company, Inc. develops and operates inpatient psychiatric facilities, residential treatment centers, group homes, substance abuse facilities, and outpatient behavioral healthcare facilities to serve the behavioral health and recovery needs of communities in the United States, the United Kingdom, and Puerto Rico. Acadia Healthcare Company, Inc. was founded in 2005 and is headquartered in Franklin, Tennessee.
Algorithmic traders utilize these daily forecasts by the I Know First market prediction system as a tool to enhance portfolio performance, verify their own analysis and act on market opportunities faster. This forecast was sent to current I Know First subscribers.
How to interpret this diagram
Algorithmic Stock Forecast: The table on the left is a stock forecast produced by I Know First’s algorithm. Each day, subscribers receive forecasts for six different time horizons. Note that the top 10 stocks in the 1-month forecast may be different than those in the 1-year forecast. In the included table, only the relevant stocks have been included. The boxes are arranged according to their respective signal and predictability values (see below for detailed definitions). A green box represents a positive forecast, suggesting a long position, while a red represents a negative forecast, suggesting a short position.
Please note-for trading decisions use the most recent forecast. Get today’s forecast and Top stock picks.


