
Best Japanese Stocks Based on Artificial Intelligence: Returns up to 7.61% in 3 Days
Best Japanese Stocks
Best Japan Stocks: This forecast is part of the By Country Package, as one of I Know First’s algorithmic trading tools. The full forecast includes daily predictions for a total of 20 stocks with bullish and bearish signals:
- Top 10 Japan stocks for the long position
- Top 10 Japan stocks for the short position
Package Name: By Country – Japan Stocks
Recommended Positions: Long
Forecast Length: 3 Days (04/05/2019 – 04/09/2019)
I Know First Average: 1.84%
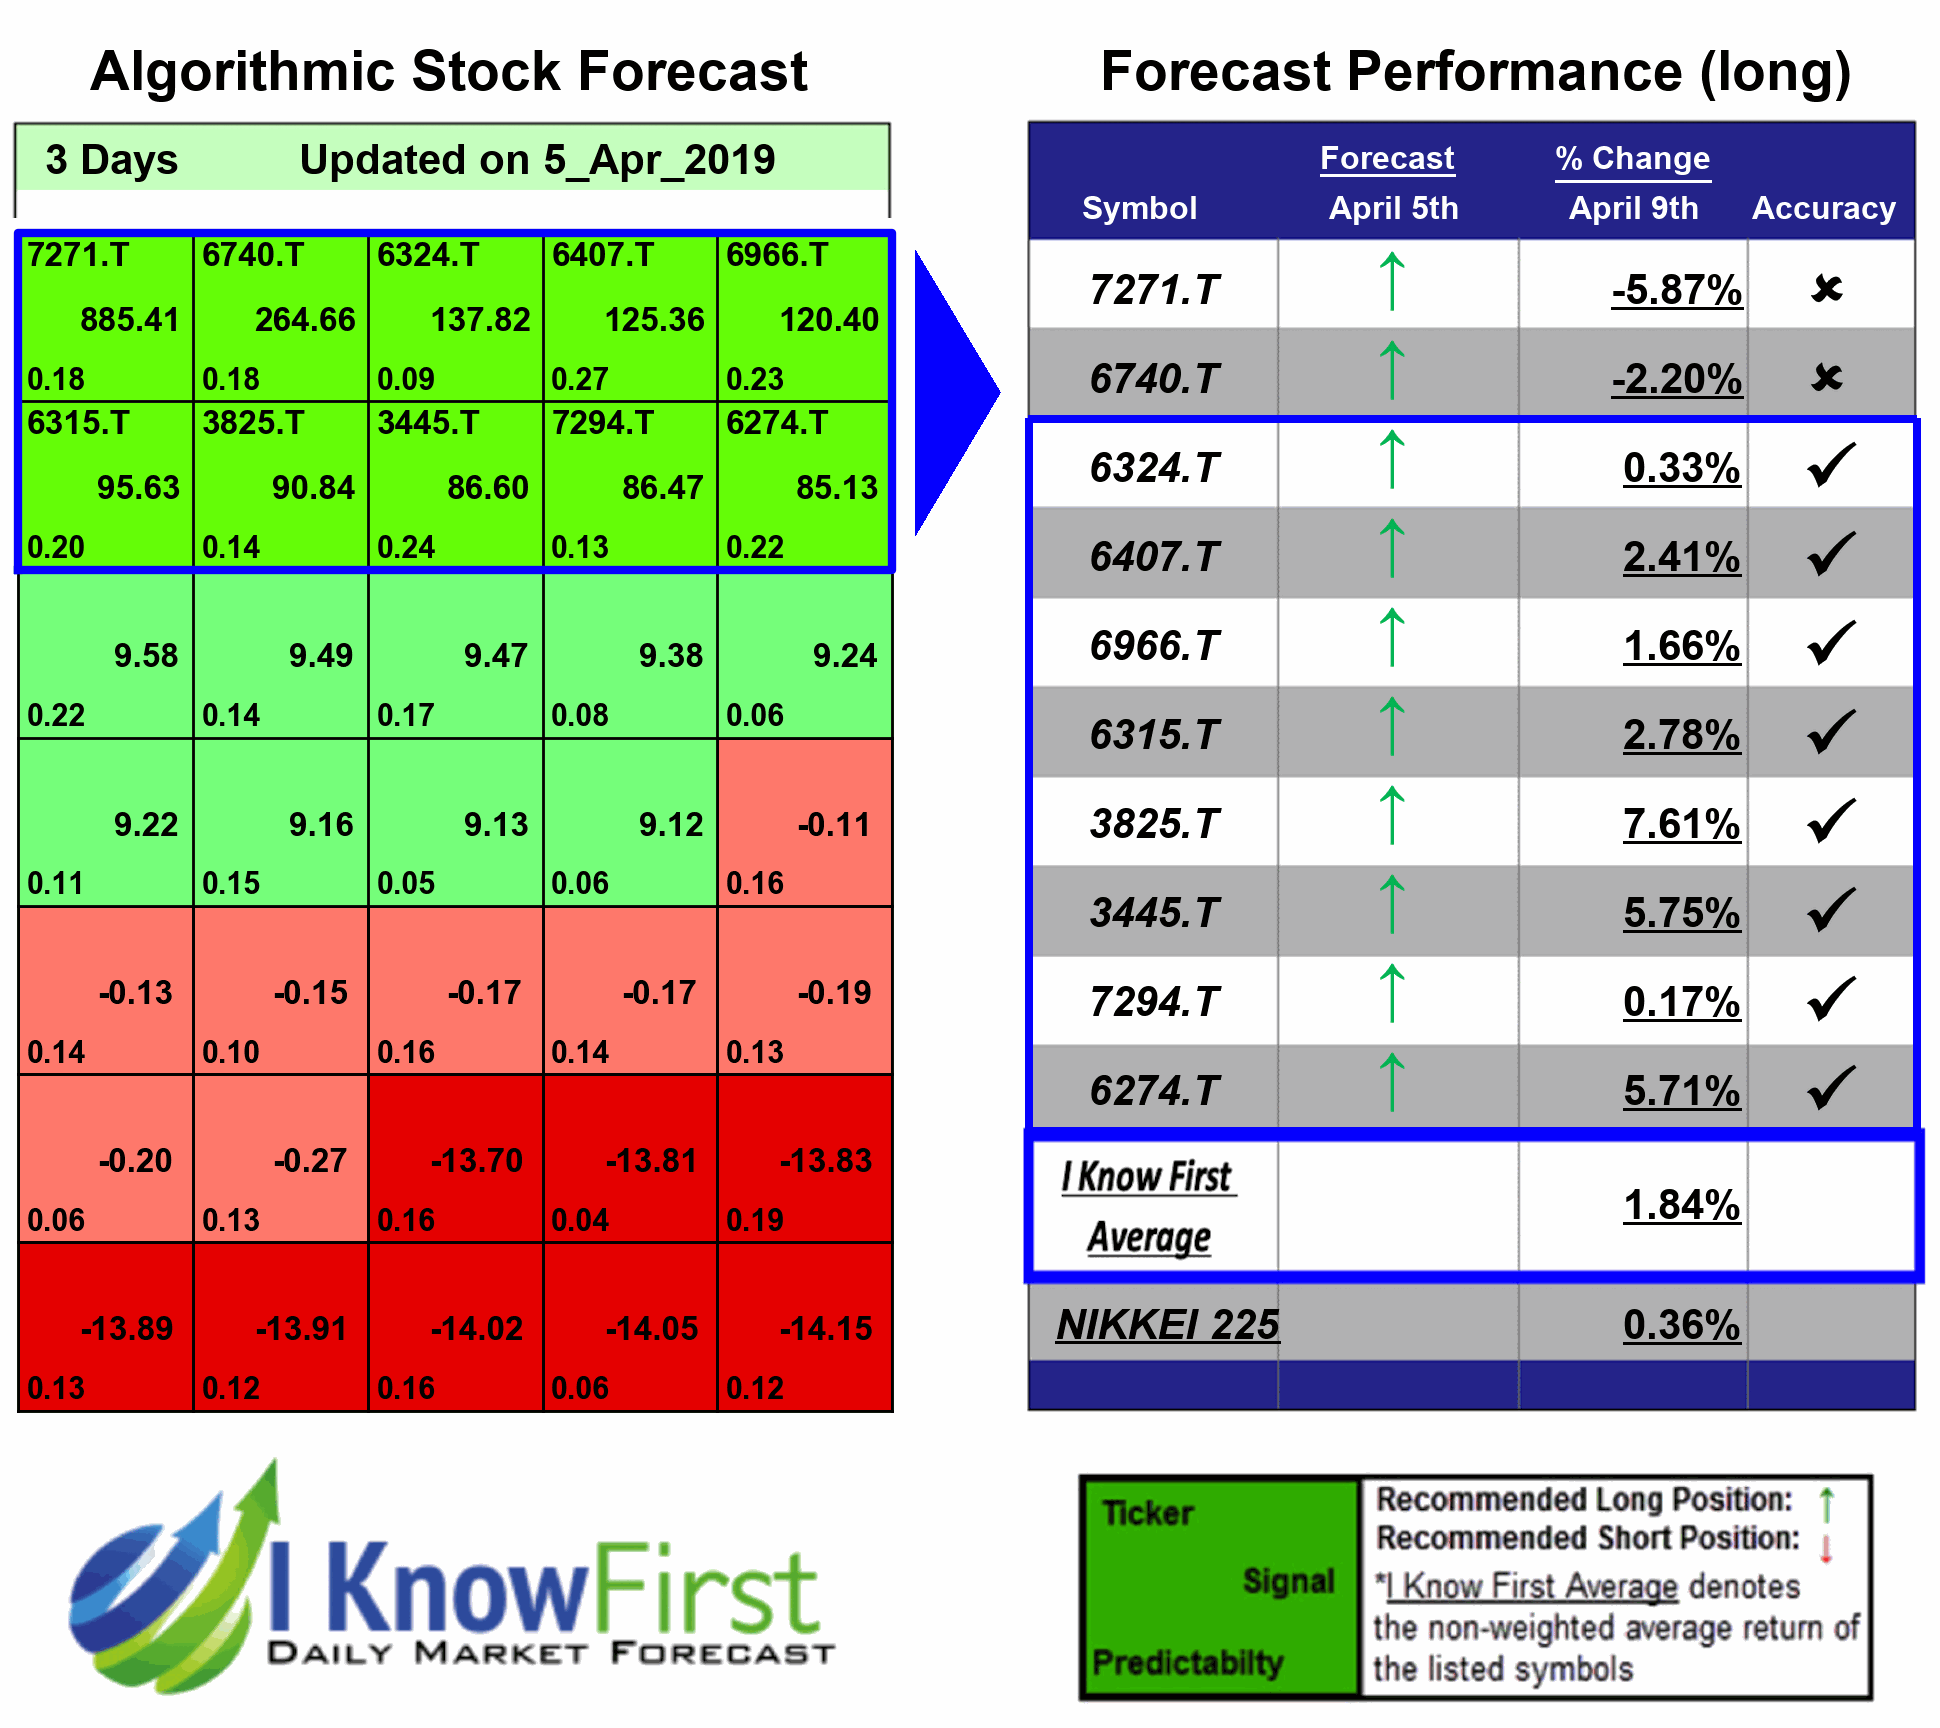
For this 3 Days forecast the algorithm had successfully predicted 8 out of 10 movements. The highest trade return came from 3825.T, at 7.61%. The suggested trades for 3445.T and 6274.T also had notable 3 Days yields of 5.75% and 5.71%, respectively. The package had an overall average return of 1.84%, providing investors with a 1.48% premium over the Nikkei 225 return of 0.36% during the period.
Remixpoint, inc. is a Japan-based company mainly engaged in energy-related business and automotive business. Energy-related business engages in the development and sales of energy management systems, energy saving support consulting, sales of energy saving equipment, as well as purchase and sale power. Automotive-related businesses engages in the development and sale of used car assessment system, buying and selling of used cars related consulting, as well as the buying and selling of used cars. The Company also engages in operating of virtual currency trading post related services.
Algorithmic traders utilize these daily forecasts by the I Know First market prediction system as a tool to enhance portfolio performance, verify their own analysis and act on market opportunities faster. This forecast was sent to current I Know First subscribers.
How to interpret this diagram
Algorithmic Stock Forecast: The table on the left is a stock forecast produced by I Know First’s algorithm. Each day, subscribers receive forecasts for six different time horizons. Note that the top 10 stocks in the 1-month forecast may be different than those in the 1-year forecast. In the included table, only the relevant stocks have been included. The boxes are arranged according to their respective signal and predictability values (see below for detailed definitions). A green box represents a positive forecast, suggesting a long position, while a red represents a negative forecast, suggesting a short position.
Please note-for trading decisions use the most recent forecast. Get today’s forecast and Top stock picks.


