
European ETFs Based on Machine Learning: Returns up to 20.07% in 3 Months
European ETFs
This forecast is part of the ETFs Package, as one of I Know First’s quantitative investment solutions. We determine the top ETFs by screening our database daily using our advanced algorithm. The full ETFs Package includes a daily forecast for a total of 20 European ETFs ETFs with bullish and bearish signals:
- Top 10 European ETFs for the long position
- Top 10 European ETFs for the short position
Package Name: European ETFs Forecast
Recommended Positions: Long
Forecast Length: 3 Months (6/11/2019 – 9/11/2019)
I Know First Average: 7.13%
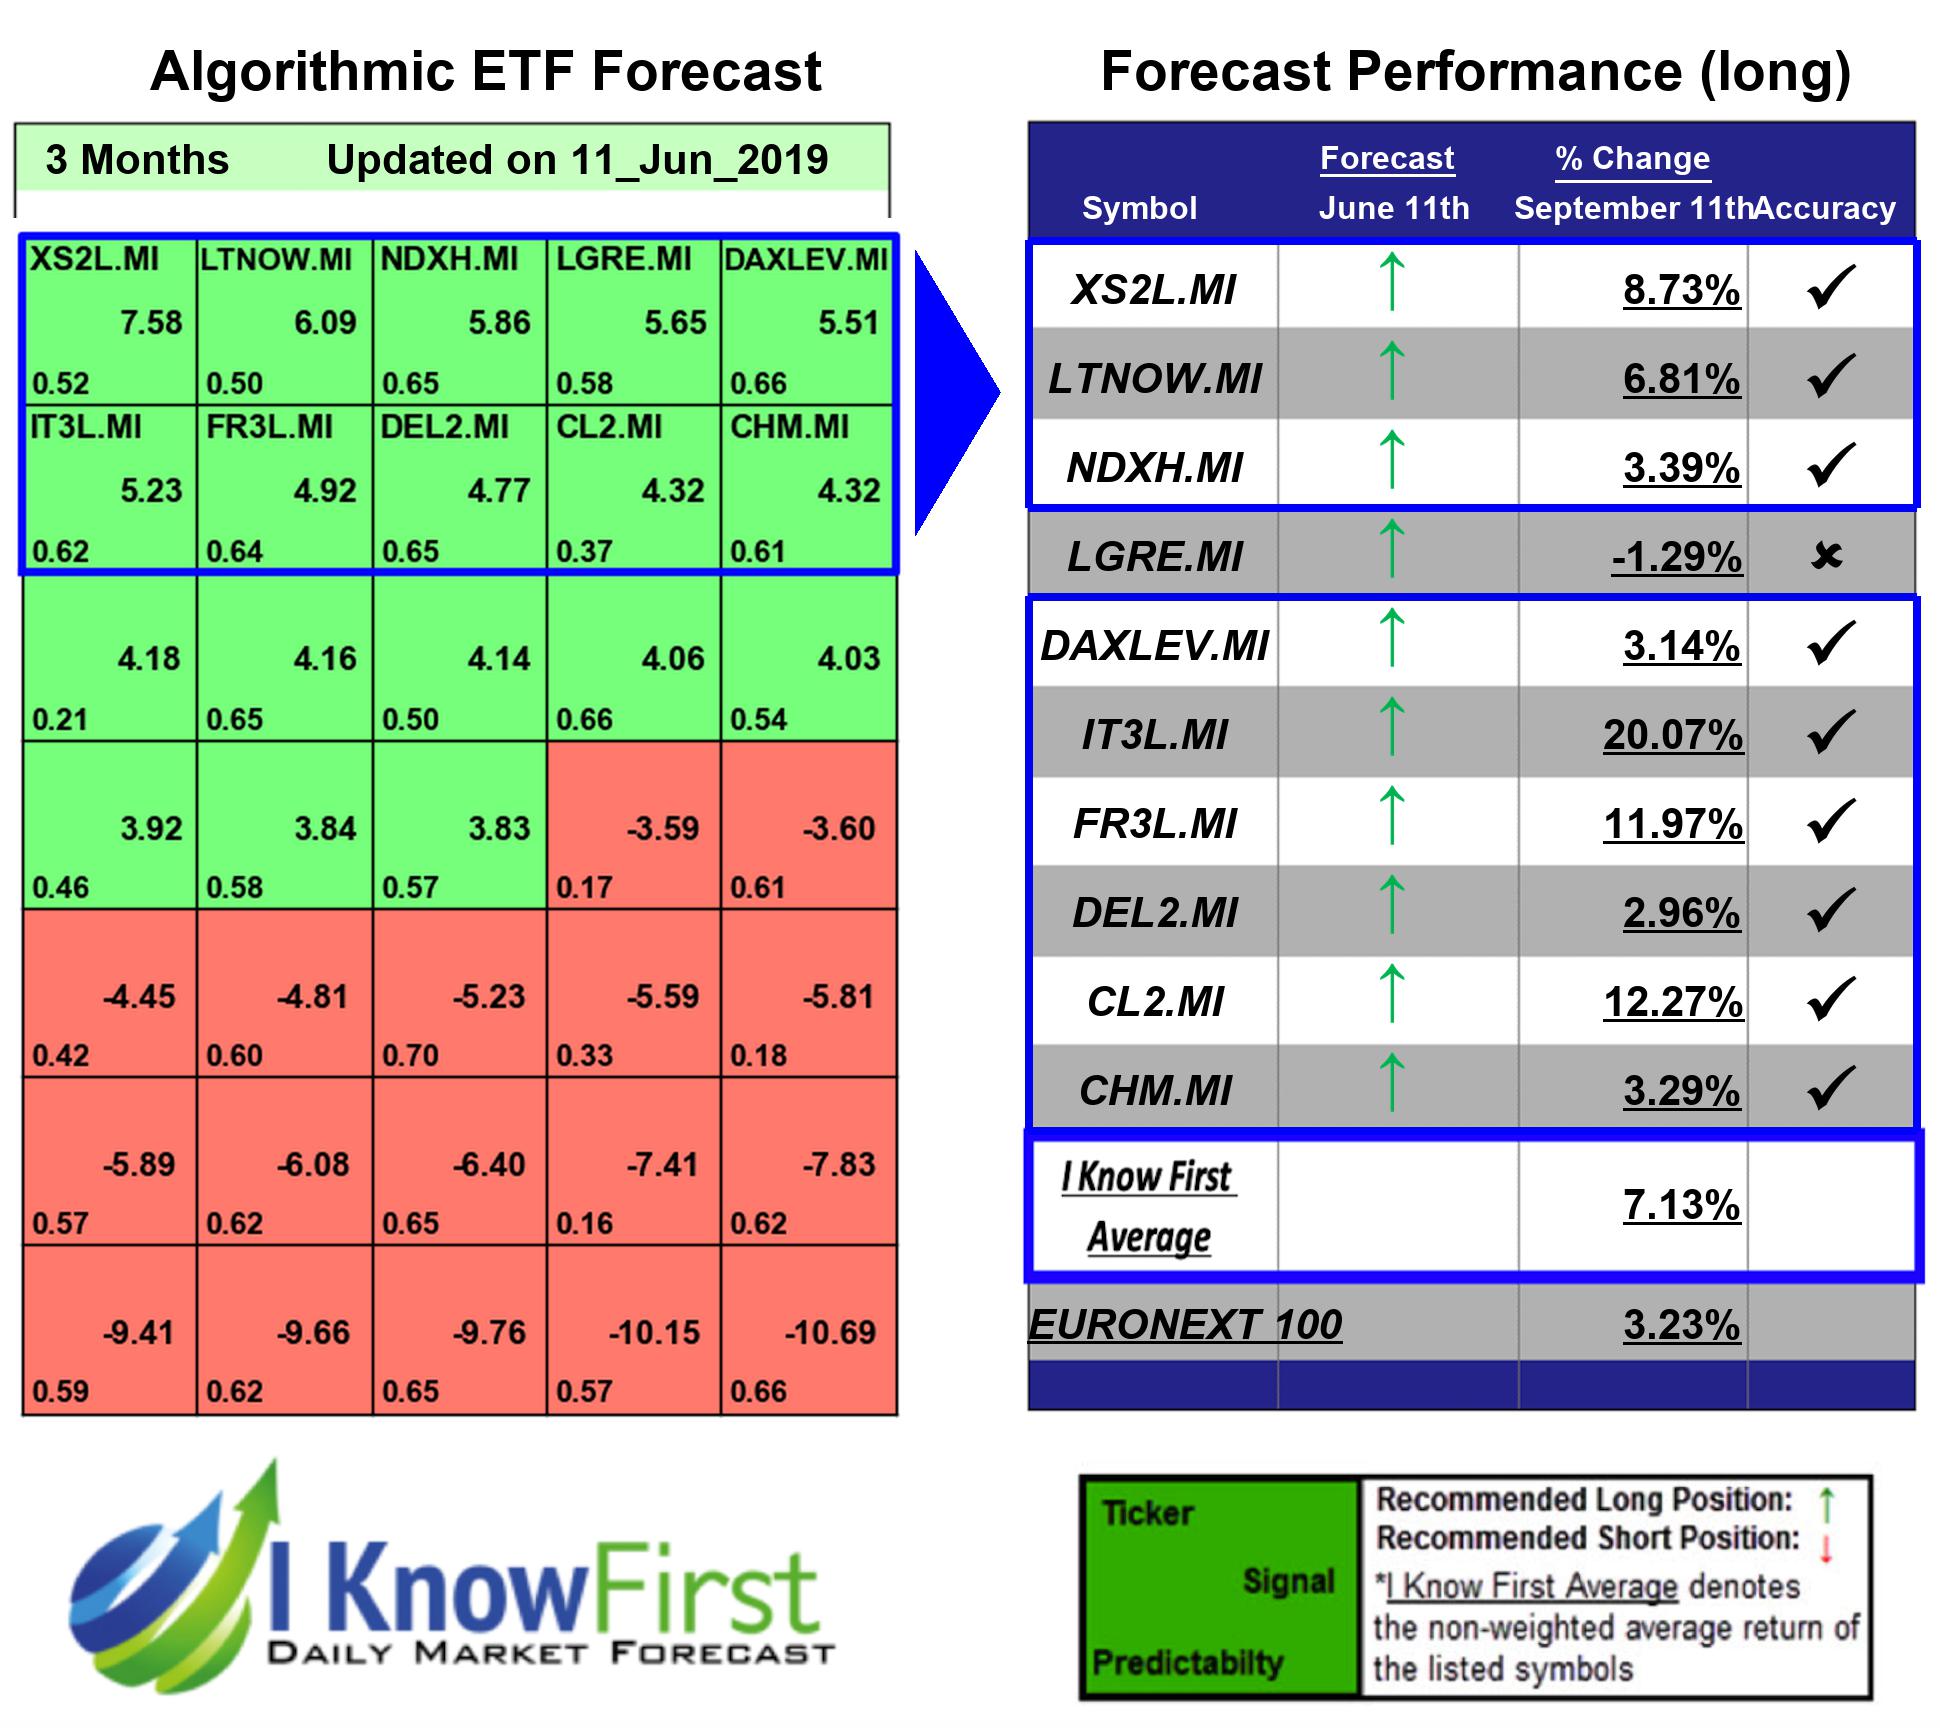
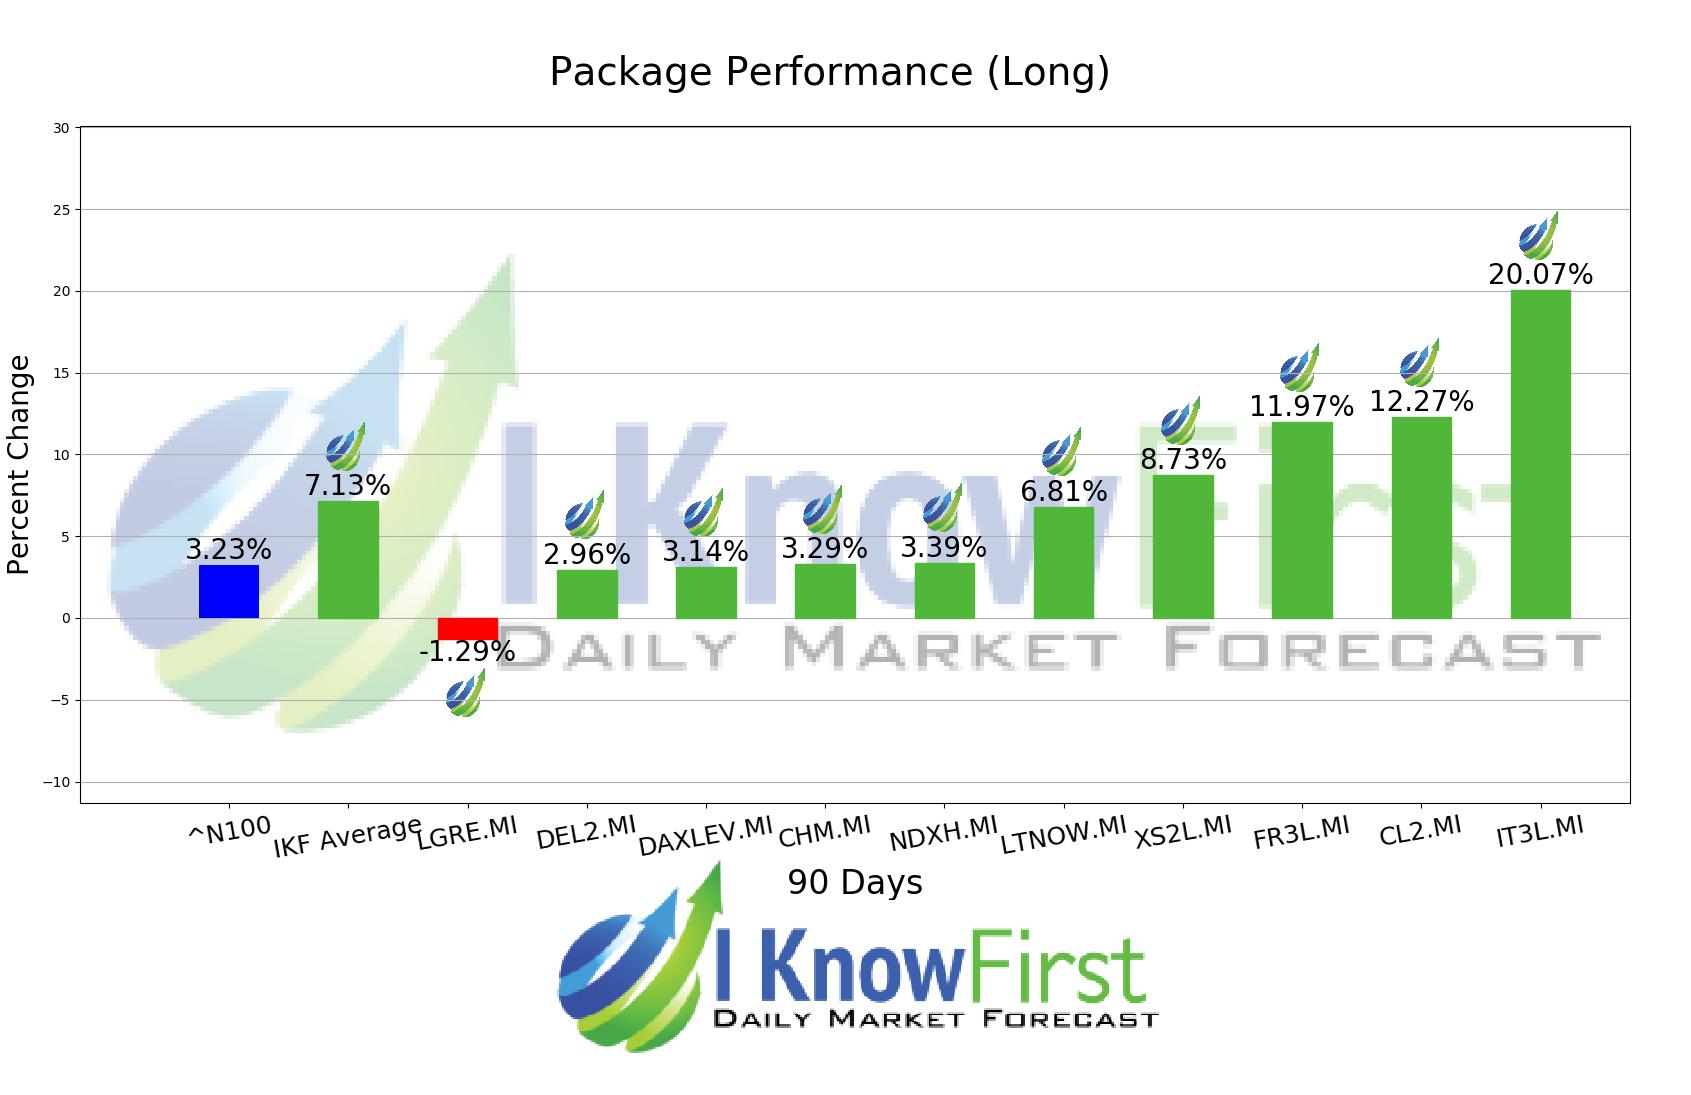
During the 3 Months forecasted period several picks in the European ETFs Forecast Package saw significant returns. The algorithm had correctly predicted 9 out 10 returns. The highest trade return came from IT3L.MI, at 20.07%. Other notable stocks were CL2.MI and FR3L.MI with a return of 12.27% and 11.97%. The package had an overall average return of 7.13%, providing investors with a 3.90% premium over the Euronext 100 return of 3.23% during the period.
ETFS 3x Daily Long FTSE MIB (IT3L) is designed to enable investors to gain a three times daily leveraged ‘long’ exposure to FTSE MIB Net Total Return Index (FTSE MIB) by tracking the FTSE MIB Daily Super Leveraged RT Net TR Index (the “Index”). A three times daily leveraged long exposure means that the product is designed to reflect three times the daily percentage change in the FTSE MIB. For example, if the FTSE MIB was to rise in value by 5% on a particular day, the product would increase in value by 15% on that day (before fees, expenses and adjustments). IT3L is an exchange traded product (“ETP”). It is not a UCITS. Securities in this ETP are structured as debt securities and not as shares (equity) and can be created and redeemed on demand by authorised participants and are traded on exchange just like shares in a company. The ETP is backed by swaps.
Algorithmic traders utilize these daily forecasts by the I Know First market prediction system as a tool to enhance portfolio performance, verify their own analysis and act on market opportunities faster. This forecast was sent to current I Know First subscribers.
How to interpret this diagram
Algorithmic Stock Forecast: The table on the left is a stock forecast produced by I Know First’s algorithm. Each day, subscribers receive forecasts for six different time horizons. Note that the top 10 stocks in the 1-month forecast may be different than those in the 1-year forecast. In the included table, only the relevant stocks have been included. The boxes are arranged according to their respective signal and predictability values (see below for detailed definitions). A green box represents a positive forecast, suggesting a long position, while a red represents a negative forecast, suggesting a short position.
Please note-for trading decisions use the most recent forecast. Get today’s forecast and Top stock picks.


