
ETF To Buy Based on Machine Learning: Returns up to 39.55% in 3 Months
ETF To Buy
This ETF To Buy forecast is part of the ETFs Package, as one of I Know First’s quantitative investment solutions. We determine the top ETFs by screening our database daily using our advanced algorithm. The full ETFs Package includes a daily forecast for a total of 20 ETFs with bullish and bearish signals:
- Top 10 ETFs for the long position
- Top 10 ETFs for the short position
Package Name: ETFs Forecast
Recommended Positions: Long
Forecast Length: 3 Months (1/18/22 – 4/18/22)
I Know First Average: 9.87%
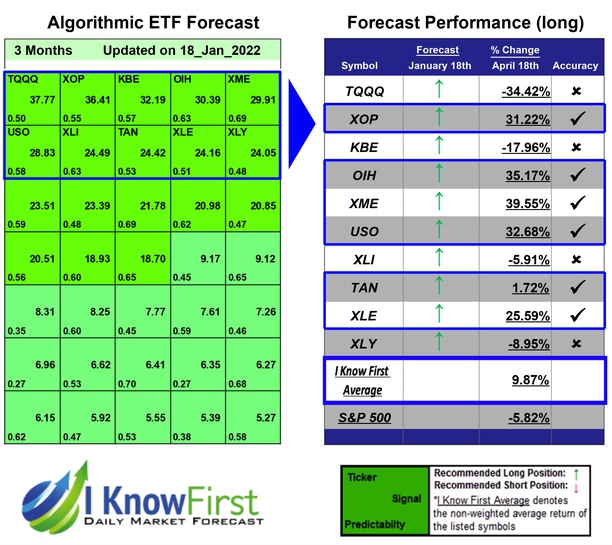

The algorithm correctly predicted 6 out of 10 the suggested trades in the ETFs Forecast Package for this 3 Months forecast. XME was the highest-earning trade with a return of 39.55% in 3 Months. OIH, and USO had notable returns of 35.17% and 32.68%. The overall average return in this ETFs Forecast package was 9.87%, providing investors with a 15.69% premium over the S&P 500’s return of -5.82% during the same period.
The SPDR S&P Metals & Mining ETF (XME) seeks to provide investment results that, before fees and expenses, correspond generally to the total return performance of the S&P Metals and Mining Select Industry Index.
Algorithmic traders utilize these daily forecasts by the I Know First market prediction system as a tool to enhance portfolio performance, verify their own analysis and act on market opportunities faster. This forecast was sent to current I Know First subscribers.
How to interpret this diagram
Algorithmic Stock Forecast: The table on the left is a stock forecast produced by I Know First’s algorithm. Each day, subscribers receive forecasts for six different time horizons. Note that the top 10 stocks in the 1-month forecast may be different than those in the 1-year forecast. In the included table, only the relevant stocks have been included. The boxes are arranged according to their respective signal and predictability values (see below for detailed definitions). A green box represents a positive forecast, suggesting a long position, while a red represents a negative forecast, suggesting a short position.
Please note-for trading decisions use the most recent forecast. Get today’s forecast and Top stock picks.


